Periodic Operators
About Periodic Operators
If you assign a periodic aggregated item to a visualization or report object that contains dates, the aggregated item displays the aggregated
values for each time period in the visualization or report object.
In a visualization or report object that does not contain dates, the aggregated item
displays values
that use today’s date as a reference. If the date data item for the operator does not contain data for the interval that contains today’s date, then the operator
returns missing values.
Periodic operators are evaluated using time intervals. Intervals specify whether the aggregation is applied on a monthly basis, a quarterly
basis, and so on. You can specify a specific interval, or you can specify that the
interval is inferred. For an inferred interval, the aggregation is evaluated based
on its context in the visualization or report object. For example, if your visualization
contains a bar chart of sales by month, then the inferred interval is monthly.
Note: Periodic operators return
a missing value in the following scenarios:
-
Data does not exist for the specified time period.
-
The date data item for the period calculation does not match the date data item in the visualization or report object. You must use the same date data item or a duplicate data item that is based on the same data item.
-
The interval for the operator is smaller than the interval of the date format in the visualization or report object (for example, if your interval is by month, but the date format is Year).
-
For operators that use inner and outer intervals, the inner interval is larger than the outer interval.
-
The inferred interval is by week of the year or by an interval smaller than a day.
-
The inferred interval is by day for any operator that has an offset other than 0.For the explorer, the ParallelPeriod and RelativePeriod operators always return a missing value when the inferred interval is by day.
The following periodic
operators are available:
|
returns the aggregated
value for a period of time and all of the previous periods of time
within a larger period of time (for example, the year-to-date total
of monthly values).
|
|
|
returns the aggregated
value for a period of time that is parallel to the current period
of time (for example, the value for the same month of the previous
year).
|
|
|
returns the aggregated
value for a period of time (for example, the value for the current
month).
|
|
|
returns the aggregated
value for a specific, constant period of time (for example, the value
for the month that includes 15OCT2013).
|
|
|
returns the aggregated
value for a period of time that is relative to the current period
(for example, the value for the previous month of the same year).
|
CumulativePeriod
The CumulativePeriod operator returns aggregated values for a period of time and all
of the previous periods, within
a larger period of time (for example, the year-to-date total of monthly values).
Note: The CumulativePeriod operator
resets at the beginning of each calendar year. You cannot have a CumulativePeriod
operator with a date range that overlaps two calendar years.
Specify the following
parameters:
Parameters for the CumulativePeriod Operator
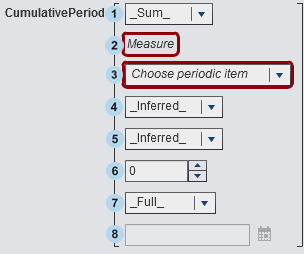
| 1 | The aggregation that is applied to the measure. |
| 2 | The measure to aggregate over time. |
| 3 | The date data item for the period calculation. Only data items whose formats specify year are available. |
| 4 | The inner interval (smaller time period) for which the values are aggregated. For
example, specify _ByMonth_ as the inner interval and _ByYear_ as the outer interval
to aggregate the year-to-date values for each month.
Select one of the following:
_Inferred_
specifies that the interval is determined automatically from the visualization or
report object that displays the aggregated item.
_ByMonth_
specifies a monthly interval.
_ByQuarter_
specifies a quarterly
interval.
_ByYear_
specifies a yearly
interval.
|
| 5 | The outer interval (larger time period) that provides the context for the cumulative
aggregation. For example, specify _ByMonth_ as the inner interval and _ByYear_ as
the outer interval to aggregate the year-to-date values for each month.
Select one of the following:
_Inferred_
specifies that the interval is determined automatically from the visualization or
report object that displays the aggregated item.
_ByMonth_
specifies a monthly interval.
_ByQuarter_
specifies a quarterly
interval.
_ByYear_
specifies a yearly
interval.
|
| 6 | The number of outer intervals to offset from the current period. 0 specifies that
the period from the current outer interval
is used. A negative value indicates a previous interval.
For example, if your
inner interval is by month and your outer interval is by year, then
-1 specifies the year-to-date monthly values for the previous year.
|
| 7 | The
scope for the period. The scope specifies how much of each period
is aggregated.
Select one of the following:
_Full_
aggregates the values for the entire period.
_ToDate_
aggregates only the values up to a specific day of the outer interval.
_ToToday_
aggregates only the values up to the equivalent of today’s position in the current
interval.
For example, if today is the 40th day of the quarter, and the outer interval is by
quarter, then only the values up to the 40th day of each quarter are used.
The value for today is evaluated dynamically whenever the aggregated item is viewed
in a visualization or report object.
|
| 8 | If you select _ToDate_ as the scope, then select the date that is used to subset each period.
For example, if you
select 09NOV2013, and the outer interval is by year, then only the
values up to November 9 of each year are used in the aggregation.
|
For example,
CumulativePeriod(_Sum_, 'Expenses'n, 'Date'n, _ByMonth_, _ByYear_, 0, _Full_)aggregates the sum of year-to-date monthly values for the Expenses measure using date values from the Date data item.
ParallelPeriod
The ParallelPeriod operator returns aggregated values for a period of time that is
parallel to the current period
(for example, the value for the same month of the previous year).
Specify the following
parameters:
Parameters for the ParallelPeriod Operator
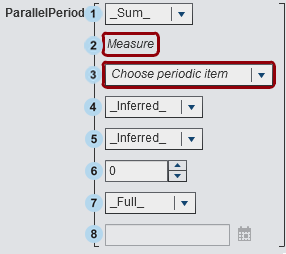
| 1 | The aggregation that is applied to the measure. |
| 2 | The measure to aggregate over time. |
| 3 | The date data item for the period calculation. Only data items whose formats specify year are available. |
| 4 | The inner interval (smaller time period) for which the values are aggregated. For
example, specify _ByMonth_ as the inner interval to aggregate the values for each
month.
Select one of the following:
_Inferred_
specifies that the interval is determined automatically from the visualization or
report object that displays the aggregated item.
_ByMonth_
specifies a monthly interval.
_ByQuarter_
specifies a quarterly
interval.
_ByYear_
specifies a yearly
interval.
|
| 5 | The outer interval (larger time period) that provides the context for the parallel
period aggregation. For example, specify _ByMonth_ as the inner interval and _ByYear_
as the outer interval to aggregate the monthly values for a different year.
Select one of the following:
_Inferred_
specifies that the interval is determined automatically from the visualization or
report object that displays the aggregated item.
_ByMonth_
specifies a monthly interval.
_ByQuarter_
specifies a quarterly
interval.
_ByYear_
specifies a yearly
interval.
|
| 6 | The number of outer intervals to offset from the current period. 0 specifies that
the period from the current outer interval
is used. A negative value indicates a previous interval.
For example, if your
inner interval is by month and your outer interval is by year, then
-1 specifies the monthly values for the previous year.
|
| 7 | The
scope for the period. The scope specifies how much of each period
is aggregated.
Select one of the following:
_Full_
aggregates the values for the entire period.
_ToDate_
aggregates only the values up to a specific day of the outer interval.
_ToToday_
aggregates only the values up to the equivalent of today’s position in the current
interval.
For example, if today is the 40th day of the quarter, and the outer interval is by
quarter, then only the values up to the 40th day of each quarter are used.
The value for today is evaluated dynamically whenever the aggregated item is viewed
in a visualization or report object.
|
| 8 | If you select _ToDate_ as the scope, then select the date that is used to subset each
period.
For example, if you
select 09NOV2013, and the outer interval is by year, then only the
values up to November 9 of each year are used in the aggregation.
|
For example,
ParallelPeriod(_Sum_, 'Expenses'n, 'Date'n, _ByMonth_, _ByYear_, -1, _Full_)aggregates the sum of monthly values for the Expenses measure for the previous year using date values from the Date data item.
Period
The Period operator returns aggregated values for a period of time (for example, the
value for the current
month).
Specify the following
parameters:
Parameters for the Period Operator
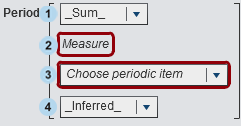
| 1 | The aggregation that is applied to the measure. |
| 2 | The measure to aggregate over time. |
| 3 | The date data item for the period calculation. Only data items whose formats specify year are available. |
| 4 | The interval for which the values are aggregated. For example, specify _ByMonth_ as
the interval to aggregate the values for each month.
Select one of the following:
_Inferred_
specifies that the interval is determined automatically from the visualization or
report object that displays the aggregated item.
_ByMonth_
specifies a monthly interval.
_ByQuarter_
specifies a quarterly
interval.
_ByYear_
specifies a yearly
interval.
|
For example,
Period(_Sum_, 'Expenses'n, 'Date'n, _ByMonth_)aggregates the sum of monthly values for the Expenses measure using date values from the Date data item.
PeriodWithDate
The PeriodWithDate operator returns aggregated values for a specific, constant period
of time (for example, the
value for the month that includes 15OCT2013).
Specify the following
parameters:
Parameters for the PeriodWithDate Operator
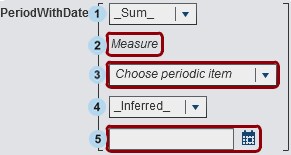
| 1 | The aggregation that is applied to the measure. |
| 2 | The measure to aggregate over time. |
| 3 | The date data item for the period calculation. Only data items whose formats specify year are available. |
| 4 | The interval for which the values are aggregated. For example, specify _ByMonth_ as
the interval to aggregate the values for each month.
Select one of the following:
_Inferred_
specifies that the interval is determined automatically from the visualization or
report object that displays the aggregated item.
_ByMonth_
specifies a monthly interval.
_ByQuarter_
specifies a quarterly
interval.
_ByYear_
specifies a yearly
interval.
|
| 5 | The reference date for the period aggregation. |
For example,
PeriodWithDate(_Sum_, 'Expenses'n, 'Date'n, _ByMonth_, '15OCT2013'd)aggregates the sum of monthly values for the Expenses measure using date values from the Date data item.
RelativePeriod
The RelativePeriod operator returns aggregated values for a period of time that is
relative to the current period
(for example, the previous month of the same year).
Specify the following
parameters:
Parameters for the RelativePeriod Operator
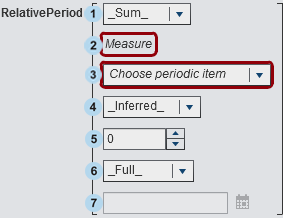
| 1 | The aggregation that is applied to the measure. |
| 2 | The measure to aggregate over time. |
| 3 | The date data item for the period calculation. Only data items whose formats specify year are available. |
| 4 | The interval for which the values are aggregated. For example, specify _ByMonth_ as
the interval to aggregate the year-to-date values for each month.
Select one of the following:
_Inferred_
specifies that the interval is determined automatically from the visualization or
report object that displays the aggregated item.
_ByMonth_
specifies a monthly interval.
_ByQuarter_
specifies a quarterly
interval.
_ByYear_
specifies a yearly
interval.
|
| 5 | The number of intervals to offset from the current period. 0 specifies that the period
from the current interval is
used. A negative value indicates a previous interval.
For example, if your
interval is by month, then -1 specifies the monthly values for the
previous month.
|
| 6 | The
scope for the period. The scope specifies how much of each period
is aggregated.
Select one of the following:
_Full_
aggregates the values for the entire period.
_ToDate_
aggregates only the values up to a specific day of the interval.
_ToToday_
aggregates only the values up to the equivalent of today’s position in the current
interval.
For example, if today is the 40th day of the quarter, and the outer interval is by
quarter, then only the values up to the 40th day of each quarter are used.
The value for today is evaluated dynamically whenever the aggregated item is viewed
in a visualization or report object.
|
| 7 | If you select _ToDate_ as the scope, then select the date that is used to subset each
period.
For example, if you
select 09NOV2013 and the outer interval is by quarter, then only the
values up to the 40th day of each quarter are used in the aggregation.
|
For example,
RelativePeriod(_Sum_, 'Expenses'n, 'Date'n, _ByMonth_, -1, _Full_)aggregates the sum of monthly values for the Expenses measure for the previous month using date values from the Date data item.
Copyright © SAS Institute Inc. All Rights Reserved.