Working with Basic Filters
About Basic Filters
For all visualization types, you can subset your data by using the Filters tab. You can base your filters on any data item, regardless of whether the data item is assigned to the current visualization.
Your filters can be
either local filters that apply only to the current visualization or global filters that apply to all of the visualizations for the selected data source. In the Filters tab, the local filters area is
labeled Visualization and the global filters area is labeled with the name of the selected data source
for the current visualization.For more information,
see Set the Scope of a Filter (Global or Local).
The total percentage
of values that are selected by your filters is displayed at the bottom
of the Filters tab. The tooltip for the percentage displays the exact number of data rows. The percentage is calculated
after data source filters are applied.
Create a Basic Filter
To create a basic filter:
-
For a local filter, either right-click on the data item, and select Add as Filter on Visualization, or drag and drop the data item onto the local filters area of the Filters tab.For a global filter, either right-click on the data item, and select Add as Filter on data-source, or drag and drop the data item onto the global filters area of the Filters tab.Note: If a local filter exists for a data item in any of your visualizations, then you cannot create a new global filter for that data item. Remove the local filter, or change its scope to global. Similarly, if a global filter exists for a data item, then you cannot create a local filter for that data item.
-
Set the parameters for your filter. You can use either visual filter controls or the Edit Filter window.Note: By default, your filter changes are applied automatically to the active visualization. To apply multiple changes together, deselect Auto-Update, and then click Update when you are ready to apply your filter changes.
Create a Basic Filter from a Data Selection
When you select data values in a visualization, you can use the selected values to create a basic filter.
To create a new filter
from a data selection:
Edit a Filter By Using Visual Filter Controls
Filtering Discrete Data
Note: If your data contains a large
number of discrete values, then the top 1,000 most frequent values
are displayed.
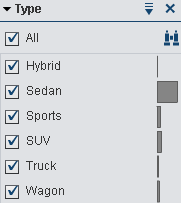
For data items that use the discrete data model, the filter displays all of the distinct values for the data item. To the right of each value, a bar indicates the frequency.
Use the check boxes next to each value to select the values for the filter. You can search for a value
in the displayed list by clicking  . Enter a text string in the field. The search locates values from the displayed list that begin with your
text string.
. Enter a text string in the field. The search locates values from the displayed list that begin with your
text string.
. Enter a text string in the field. The search locates values from the displayed list that begin with your
text string.
Select All to select or deselect all of the values. If the filter displays the top 1,000 most frequent values, then
select Include unlisted
values to select the unlisted values.
You can sort the values
by frequency or alphabetically by value. Click the  drop-down list, and then select Sort by
Frequency or Sort by Values.
drop-down list, and then select Sort by
Frequency or Sort by Values.
drop-down list, and then select Sort by
Frequency or Sort by Values.
To display the selected
values at the top of the list, click the drop-down list, and then select Show Selected
at Top.
drop-down list, and then select Show Selected
at Top.
If your data item contains more than 1,000 discrete values, then you can exclude the unlisted values by deselecting Include unlisted values.
If your data item contains missing values, then you can exclude missing values by deselecting Include
missing values.
By default, your filter changes are applied automatically to the active visualization.
To apply multiple changes together, deselect Auto-Update at
the bottom of the Filters tab, and then click Update when
you are ready to apply your filter changes.
Filtering Continuous Data
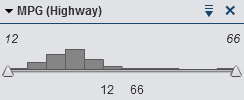
For measures that use the continuous data model, the filter shows the range of data
values as a histogram. Sliders at each side of the histogram enable you to select
the data
that is selected by the filter.
The visual filter can
select data by using different filter conditions. By default, the Between
(Inclusive) condition is used. To change the condition
for your filter, click the drop-down list, select Condition Type,
and then select the condition. Select one of the following conditions:
drop-down list, select Condition Type,
and then select the condition. Select one of the following conditions:
Between (Exclusive)
specifies that a matching value must be in the range between the lower bound and the upper bound. Matching values do not include the bounding values.
Between (Inclusive)
specifies that a matching value must be in the range between the lower bound and the
upper bound. Matching values can include the bounding values.
Equal To
specifies that a matching
value must be equal to the value specified by the filter.
Greater Than
specifies that a matching
value must be greater than the value specified by the filter.
Greater Than or Equal To
specifies that a matching
value must be greater than or equal to the value specified by the
filter.
Less Than
specifies that a matching
value must be less than the value specified by the filter.
Less Than or Equal To
specifies that a matching
value must be less than or equal to the value specified by the filter.
Not Between (Exclusive)
specifies that a matching value must be outside the range between the lower bound
and the upper bound. Matching values do not include the bounding values.
Not Between (Inclusive)
specifies that a matching value must be outside the range between the lower bound
and the upper bound. Matching values can include the bounding values.
Not Equal To
specifies that a matching
value must not be equal to the value specified by the filter.
You can specify the values for the filter by using sliders or by entering the values explicitly:
-
For numeric data, click on a value below the histogram, and then enter a new value in the text field.
-
For a continuous datetime data item, click
 , and then select a date or time.
If your data item contains missing values, then you can exclude the missing values
by deselecting Include missing values.
To invert your selection,
click the drop-down list, and then select Invert
Selection.
drop-down list, and then select Invert
Selection.
By default, your filter changes are applied automatically to the active visualization.
To apply multiple changes together, deselect Auto-Update at
the bottom of the Filters tab, and then click Update when
you are ready to apply your filter changes.
Edit a Basic Filter By Using the Edit Filter Window
To edit a basic filter
by using the Edit Filter window:
-
Edit the expression for the filter. For more information, see Editing a Filter Expression.
Copyright © SAS Institute Inc. All rights reserved.