Sharing Data Roles
About Shared Data Roles
If your graph object
contains multiple graph elements, you can specify that some data roles
be shared across two or more graph elements. You share data roles
when you want the graph elements to use the same data role for either
of their axes. When report designers who use the graph object in their
reports assign roles, a single data column is assigned to all roles
that use the shared role.
Note: If the graph element types
are compatible, overlaid graph elements are automatically assigned
a shared role. (See
Incompatible Graph Elements.) You can unshare a role if needed.
Shared roles are very
useful in user-defined lattices. They enable you to manage data roles
across columns and rows. For example, you might share data roles if
you want to analyze relationships in your data.
In this example, the
X axis of the scatter plot shares a role with the Measure axis of
the bar chart.
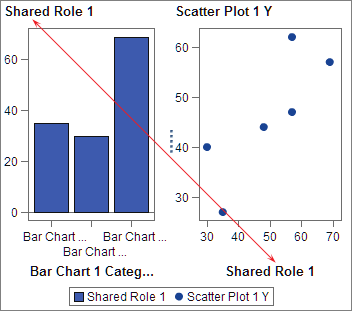
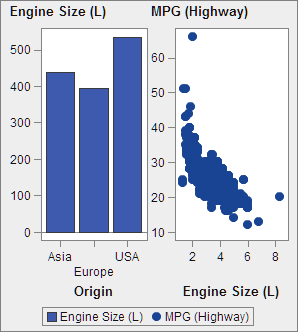
When the graph object
is used in the designer, the data might be applied as shown in the
following example.
Share or Unshare a Data Role
To share a data role,
on the Role Definitions tab, click  next to the role that you want to share. Select Create Shared Role With Another Role
 Name
of Role.
Name
of Role.
next to the role that you want to share. Select Create Shared Role With Another RoleYou can also click Add
Shared Role, and then create and share the data role.
To unshare a data role,
click next to the shared role, and select Unshare.
next to the shared role, and select Unshare.
Copyright © SAS Institute Inc. All rights reserved.