Tables
Crosstabs
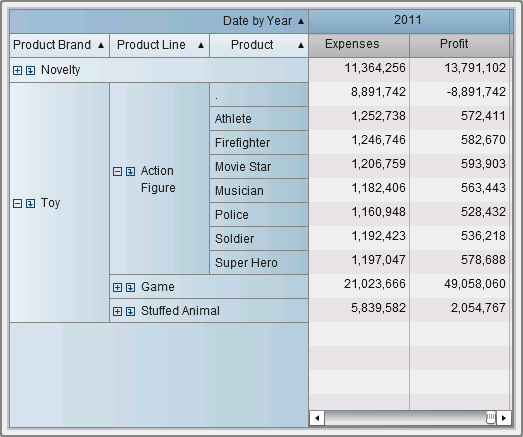
A crosstab (also
known as a crosstabulation table) shows an aggregate metric for the
intersections of two or more categories. Crosstabs often have two
or more categories assigned to both the rows and columns, forming
a matrix. Crosstabs can be easier to read than list tables because
they often use less space, and they always collapse repeating values
for outer category data items into one unique value, which is known
as grouping. A crosstab can use a hierarchy.
Copyright © SAS Institute Inc. All rights reserved.

