Working with Calculated Items in Reports
About Calculated Data Items
The designer enables
you to calculate new data items from your existing data items by using
an expression. For example, you might want to calculate a company’s
profits by subtracting expenses from revenues.
In addition to performing
mathematical calculations on numeric values, you can use calculated
data items to create date and time values. For example, if your data
contains separate categories for month, day,
and year, then you can calculate
a date value from those categories.
Note: All calculations are performed
on unaggregated data. The calculation expression is evaluated for
each row in the data source before aggregations are performed. To perform
calculations on aggregated data, see
Add a New Aggregated Measure to a Report.
Calculated data items
can accept parameters. For more information,
see
Working with Parameters in Reports.
A hierarchy can contain
calculated data items as long as they are categories.
Using the designer,
you can work with calculated data items or aggregated measures.
For information
about deleting calculated data items, see
Delete Data Items.
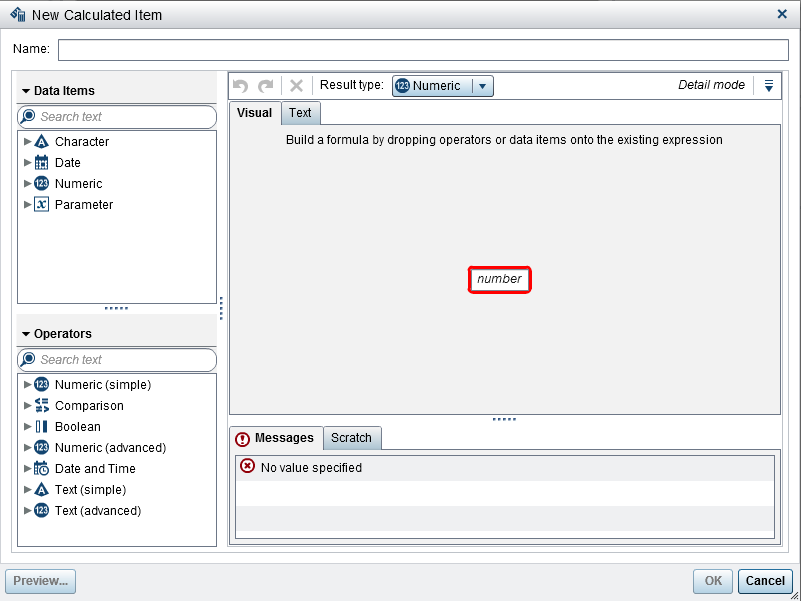
Add a New Calculated Data Item to a Report
To add a new calculated
data item:
-
The following table lists the available result types:IconResult Type
 Character
 Date
Date Datetime
 Numeric
 TimeCalculated data items in the designer always default to the following formats, which are based on the data type:
-
Date: DATE9
-
Datetime: DATETIME10
-
Time: TIME8
-
Numeric: COMMA12.2
After you create the new calculated data item, you can change its format using the data item table on the Data tab unless it is a character calculated data item. You cannot specify a format for a character calculated data item.Sum is the default aggregation for new numeric calculated data items in the designer. You can change the aggregation for numeric calculated data items using the data item table on the Data tab. -
-
Use the Visual tab to build the expression for your calculated data item by dragging Data Items and Operators onto the expression in the right pane. For each rectangular field in the expression, you can insert a data item, an operator, or a specific value.When you drag and drop data items or operators onto your expression, the precise location of the cursor determines where and how the new element is added to the expression. As you drag the new element over the expression, a preview appears that displays how the expression changes if you drop the element at that location.For example, if your current expression is ( Profit / Revenue ), and you drag and drop the x - y (subtract) operator inside the open parenthesis symbol, then the expression changes to ( [number] – ( Profit / Revenue )). If you drag and drop the operator over the division symbol, then the expression changes to ( Profit – Revenue ), and so on.Alternatively, you can use the Text tab to enter the expression.You can use the Scratch tab to build temporary expressions.There are a large number of operator types available to perform mathematical functions, process datetime values, handle text, and evaluate logical processing such as IF clauses. For more information, see Operators for Data Expressions.
-
Click OK. The new calculated data item appears on the Data tab. The
 ,
,  , or
, or  icon identifies the new calculated data item on the Data tab.
Note: The icon is displayed if you change a calculated numeric
measure to a category data item. It is also displayed for a character
calculated data item (which is always a category).
icon identifies the new calculated data item on the Data tab.
Note: The icon is displayed if you change a calculated numeric
measure to a category data item. It is also displayed for a character
calculated data item (which is always a category).

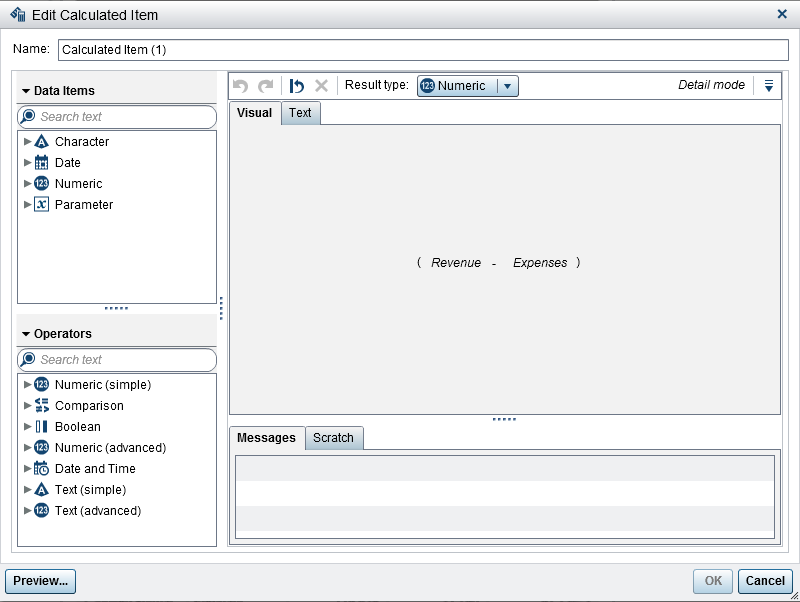
Edit a Calculated Data Item
To edit a calculated
data item:
-
Modify the Data Items and Operators for the calculated data item as needed. For information about the operators that are available, see Operators for Data Expressions.Note: If the calculated data item has not been used in a report, then you can modify the Result type.
You can duplicate, rename,
hide, and delete calculated data items using the same steps as any
other data item. If a calculated data item is used inside another
calculated data item, then it cannot be removed.
Tip
You can cut and paste from
the Text area between different reports as
well as between the explorer and the designer to transfer calculations
or to e-mail them to others. For more information,
see
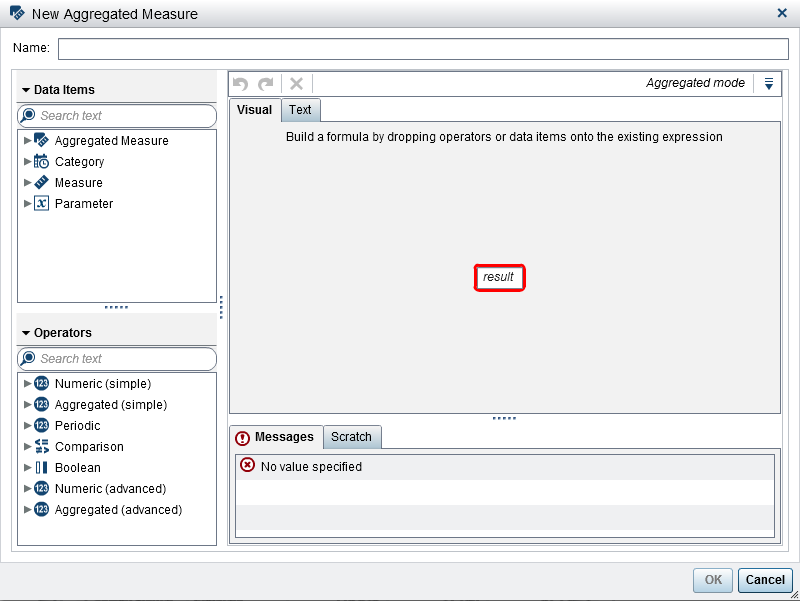
Editing a Data Expression in Text Mode.Add a New Aggregated Measure to a Report
Aggregated measures
enable you to calculate new data items by using aggregated values. For
example, you might want to calculate a company's profit margin by
region by taking the aggregated sum of the profit for all of the stores
in a region group and dividing it by the aggregated sum of the revenue
for all of the stores in that same region group. Aggregations are
evaluated as part of a calculated expression.
To add an aggregated
measure:
-
Use the Visual tab to build the expression for your aggregated measure by dragging and dropping Data Items and Operators onto the expression in the right pane. For each field in the expression, you can insert a data item, an operator, or a specific value.When you drag and drop data items and operators onto the expression, the precise location of the cursor determines where and how the data item or operator is added to the expression. As you drag the new element over the expression, a preview appears, which displays how the expression would change if you drop the element at the current location.Alternatively, you can use the Text tab to enter the expression.There are a large number of operator types available to perform mathematical functions and evaluate logical processing such as IF clauses. For more information, see Operators for Data Expressions.
-
For each data item in your expression, select an aggregation type. By default, Sum is used for measures and Distinct is used for categories. To select a new aggregation type, drag and drop an aggregated operator from the Operators list onto the aggregation type in the expression. See Operators for Data Expressions for a list of the aggregated operators that are available.
-
For each aggregation in your expression, select the aggregation context. A drop-down list beside each aggregation enables you to select one of the following context values:ByGroupcalculates the aggregation for each subset of the data item that is used in a visualization. For example, in a bar chart, an aggregated measure with the ByGroup context calculates a separate aggregated value for each bar in the chart.ForAllcalculates the aggregation for the entire data item (after filtering). For example, in a bar chart, an aggregated measure with the ForAll context uses the same aggregated value (calculated for the entire data item) for each bar in the chart.By using the ForAll and ByGroup contexts together, you can create measures that compare the local value to the global value. For example, you might calculate the difference from mean by using an expression such as the following:
Avg ByGroup(X) - Avg ForAll(X)
For more information, see Periodic Operators.

Edit an Aggregated Measure
To edit an aggregated
measure:
-
Modify the Data Items and Operators for the aggregated measure as needed. For information about the operators that are available, see Operators for Data Expressions.
You can duplicate, rename,
hide, and delete aggregated measures using the same steps as any other
data item.
Tip
You can cut and paste from
the Text area between different reports,
as well as between the explorer and the designer, to transfer calculations
or to e-mail them to others. For more information,
see
Editing a Data Expression in Text Mode.Copyright © SAS Institute Inc. All rights reserved.