Sorting Data in Reports

How Sorting Can Help with Analysis

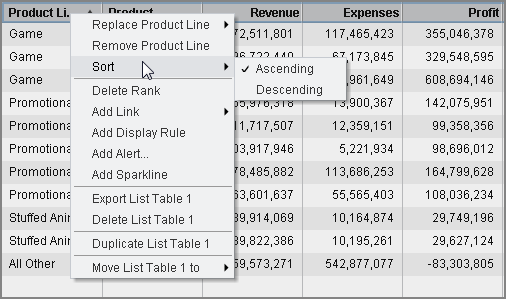
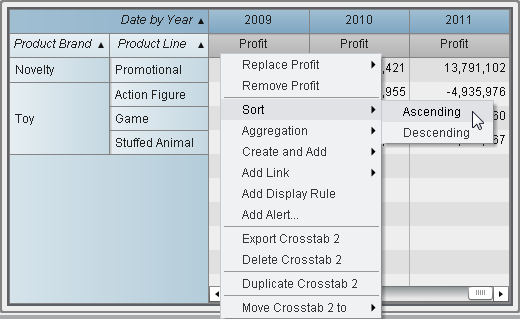
Information can be easier to understand when it appears in an intentional order. Applying a sort order to one or more data items in the designer enables you to 
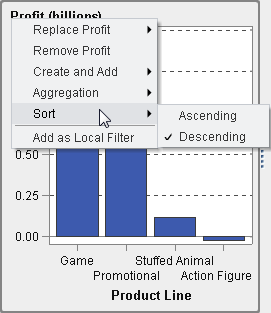
arrange rows and columns in tables and axis labels on charts in some order, such as alphabetically or highest to lowest numerically. Interactively changing the order of data can provide you with a different perspective that often facilitates valuable insight. For example, in a report, sales employees who are initially arranged alphabetically can be re-sorted by sales amount.
Ranking can help reduce the amount of visible data and is often used in combination with sorting. For more information, see Add a New Rank.

Sort Data in a List Table

To sort values in a list table, right-click on a column heading and select Sort. Then, select either Ascending or Descending.
Sort Menu Items for List Tables
Note: You can also press the spacebar to sort a single column in a table.
Tip
Use the Ctrl key to select and sort multiple columns.

Sort Data in a Crosstab

To sort by category or measure values in a crosstab, right-click on a column or row heading, and select Sort. Then, select either Ascending or Descending.
Sort Menu Items for a Crosstab
You can also sort categories, rather than measures, by clicking the category name.

Sort Data in a Graph

To sort by values in a graph, right-click on a measure name or category name, and select Sort. Then, select either Ascending or Descending.
Sort Menu Items for a Graph
Sort Menu for a Category in a Graph