Creating Interactions
Create a Filter Interaction
Note: You cannot create interactions
from list tables, bubble plots, and scatter plots that use detail
data. However, a list table that uses detail data can be the target
of an interaction.
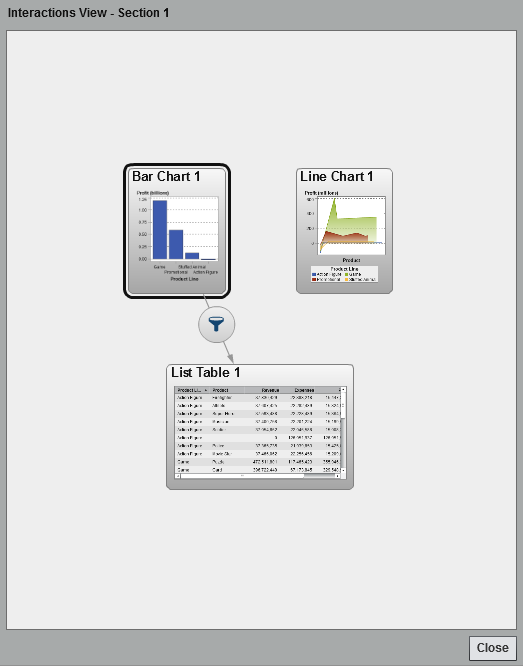
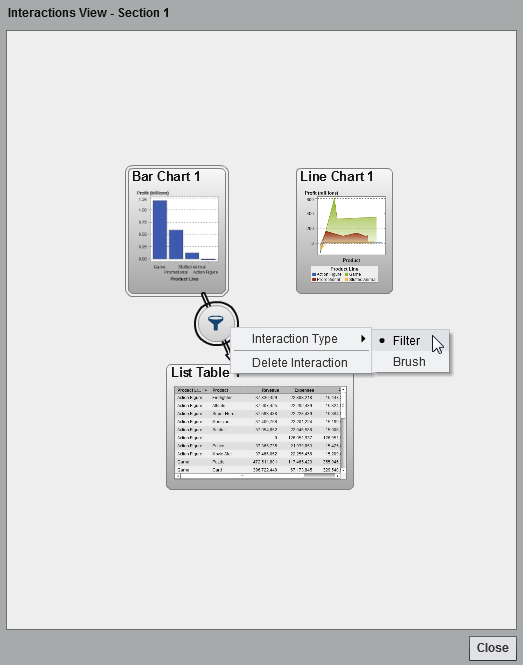
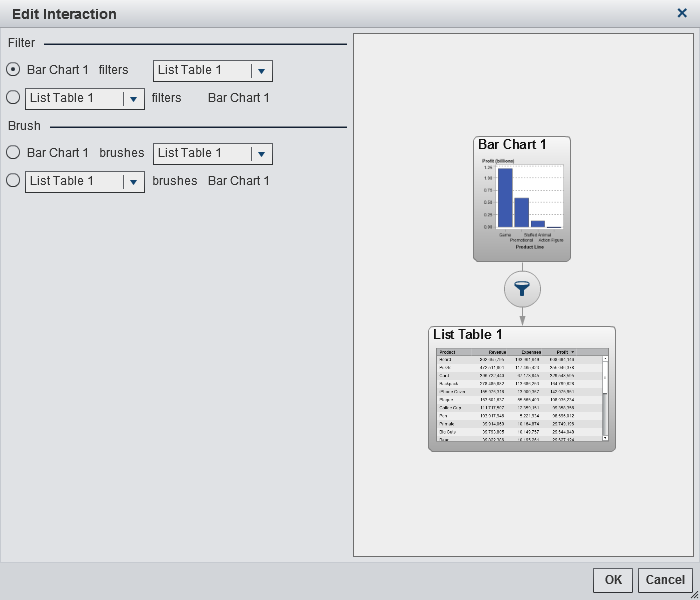
To create a filter
interaction using the interactions view:
-
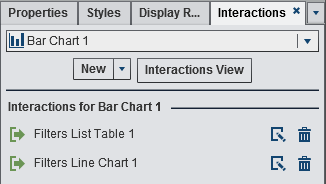
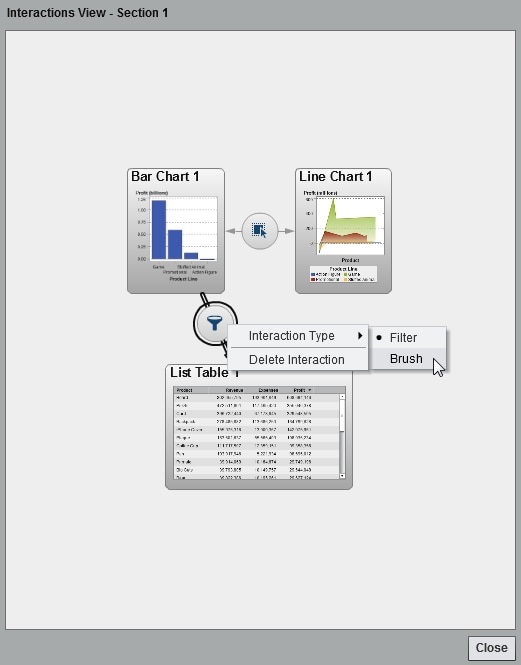
Click Close. The new interaction (or interactions) appears on the Interactions tab in the right pane.The following example shows the Interactions tab for the filtering example shown in A Filtering Example with a Bar Chart, a Line Chart, and a List Table .Interactions Tab with Two Interactions Displayed

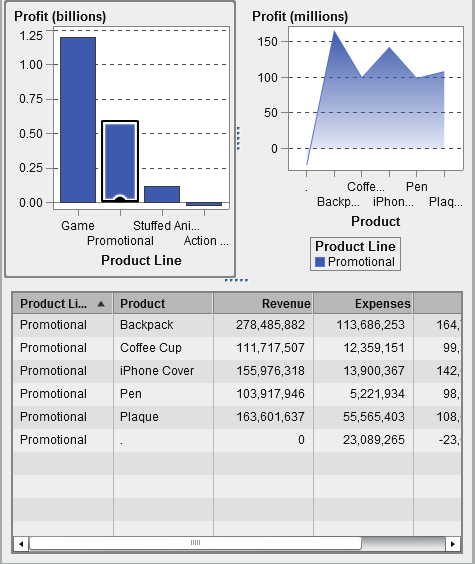
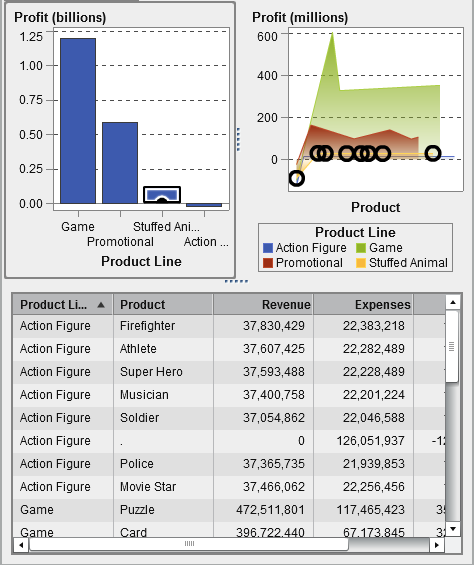
Select data in the
source report object to filter data in the target report object (or
objects). In the following example, the promotional product line was
selected in the bar chart. Simultaneously, the line chart and the
list table show the same filter.
A Filtering Example with a Bar Chart, a Line Chart, and a List
Table
Clicking on another
selection applies the filter based on your new selection. For example,
in the report above, you can click on the game product line to change
the filter. An icon is added to the report object that is filtered.
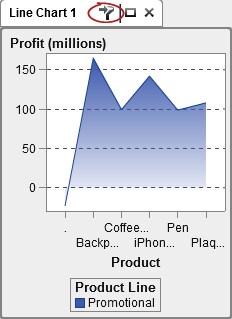
Here is the line chart
that was used in the previous example. The incoming filter icon appears
above the report object when it is selected in the canvas.
Example of a Report Object with an Incoming Filter
To clear the selection
and reset the filter (or filters), press Ctrl+click while viewing
the original report object.
To create an interaction
using the New button on the Interactions tab:
Create a Data Brushing Interaction
To create an interaction
using data brushing:

Select data in the source
report object to brush data in the target report object (or objects).
In the following example, the stuffed animal product line was selected
in the bar chart. Simultaneously, the line chart and the crosstab
highlight the same data.
Note: If a graph contains a frequency
measure, then a crosshatch pattern indicates when it is selected or
brushed.
The brush interaction
between controls behaves differently than a brush interaction between
tables and graphs. When there is a brush interaction between controls,
instead of highlighting or selecting the values in the other control,
the values that match are moved to the top of the control, and the
values that do not match are grayed out. If a frequency data item
exists, then the frequency value is updated.
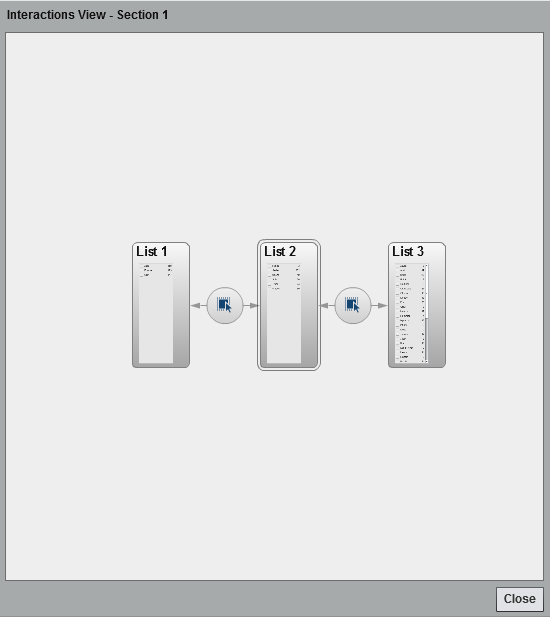
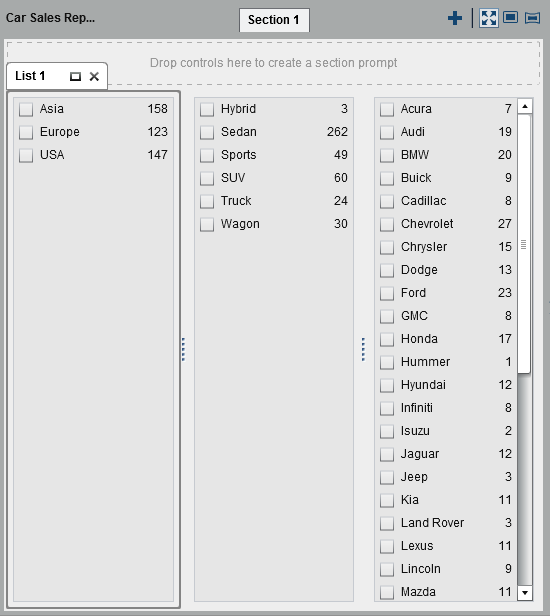
The first list contains
three countries listed as the Origin.
The second list contains six types of vehicles. The third list contains
38 car manufacturing companies. There is a brush interaction between
the first list and the second list. There is a second brush interaction
between the second list and the third list. Look at the values in
the second list.
Example: Three List Controls in a Report
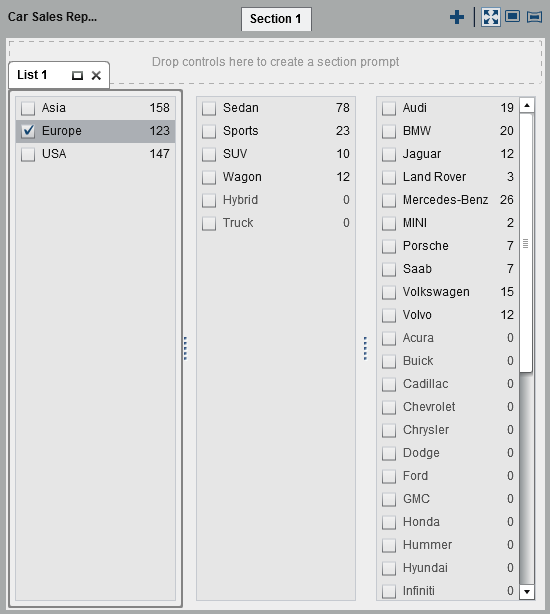
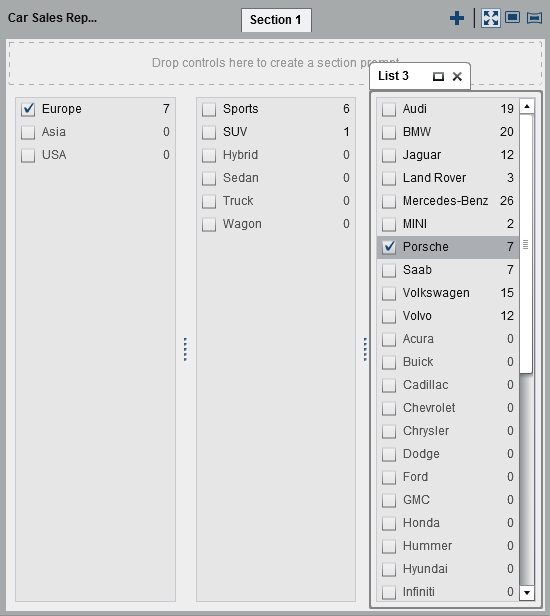
In step 1, the user
has selected Europe as
the country of Origin in
the first list. Notice the changes in the second list. Hybrid and Truck are
grayed out, and their frequency values have both changed to 0.
In the third list, all of the car manufacturers that are not located
in Europe are grayed out, and their frequency values have all changed
to 0
Example: Three List Controls in a Report with One Brush Interaction
Copyright © SAS Institute Inc. All rights reserved.