Modifying Data Role Assignments in Report Objects
After you have selected
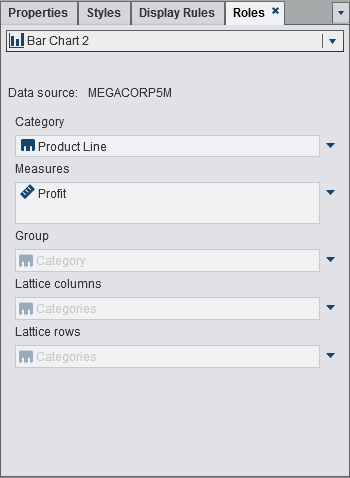
a report object and a data source, the Roles tab
in the right pane shows which data items have been assigned to which
role.
To modify data role
assignments:
-
Click
 beside the role that you want to edit. For data roles
that allow multiple data items, the menu items that are available
can vary.
If you select a data item in Roles, then the Aggregation, Add, Remove, and Replace menu items are displayed. You can also right-click on a data item, and the actions specific to that data item are displayed.Different data roles are available for different report objects. In addition to the basic data roles, you can assign additional data roles.For example, for the bar chart shown in Roles Tab, you can replace or remove the Category. For the Measure, you can modify the aggregation, add another measure, replace the existing measure, or remove the measure. You can also modify the Group, the Lattice columns, or Lattice rows.
beside the role that you want to edit. For data roles
that allow multiple data items, the menu items that are available
can vary.
If you select a data item in Roles, then the Aggregation, Add, Remove, and Replace menu items are displayed. You can also right-click on a data item, and the actions specific to that data item are displayed.Different data roles are available for different report objects. In addition to the basic data roles, you can assign additional data roles.For example, for the bar chart shown in Roles Tab, you can replace or remove the Category. For the Measure, you can modify the aggregation, add another measure, replace the existing measure, or remove the measure. You can also modify the Group, the Lattice columns, or Lattice rows.
Copyright © SAS Institute Inc. All rights reserved.