Adding a New Rank
You can use the Ranks tab
to create ranks to subset the data in your reports. You can also right-click
on your graphs and tables to add a rank to limit the number of bars,
rows, and so on. Controls and gauges support ranks.
To add a rank:
-
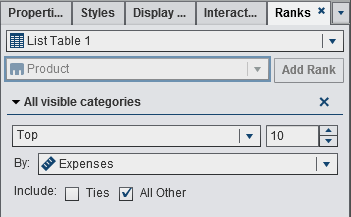
Select a data item. You can select any category or geography data item, regardless of whether it is assigned to the current report object.For list tables only, you can select All visible categories. This rank ranks across the crossing. For example, you select the region and product data items. You rank on the crossing of these data items. In this case, the column is no longer considered a single column, it is considered the crossing of the columns.
-
If you select Ties, then the rank selects as many values as necessary to include all of the ties. If you do not select Ties, then the rank selects only the number of values that are specified by the rank parameters.For example, if your rank selects the top three values, but there are five values tied for the greatest value, then the number of values that are selected by the rank depends on the Ties option. If you select Ties, then the rank includes all five of the tied values. If you do not select Ties, then the rank includes only three of the tied values.
-
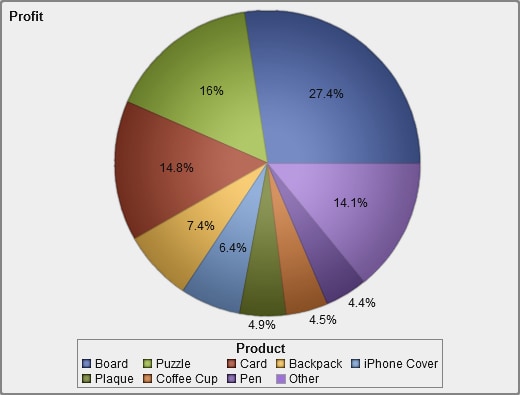
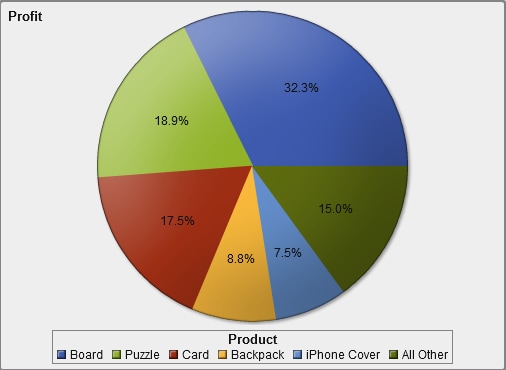
(Optional) Select All Other to show the measurements for the categories that did not qualify as a top or bottom value.Note: The All Other option is not available when there is a detail rank or when the data item is hidden. It is not available if the rank is on a prompt control, geo bubble map, or geo region map.When the All Other option is specified for a report object, the total, subtotal, and percent of total show values with respect to all of the data, rather than data just relative to data qualifying under the rank. The data that does not fit into the top or bottom of the rank is aggregated in the All Other category.You can use the All Other option with a top ranking to reduce the number of slices in a pie chart. However, this means that the “Other” slice is removed from the pie chart.
You can add more than
one rank to a report object, as long as the first rank is not a Detail
rank or an All visible categories rank.
Copyright © SAS Institute Inc. All rights reserved.