Using Data Items in a Report
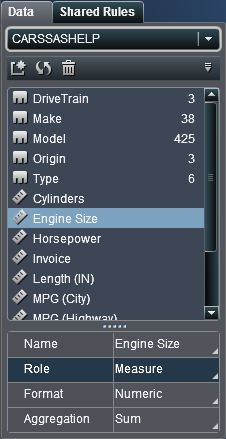
About Data Items
Each data source in
SAS Visual Analytics Designer includes one or more standard data items.
You decide which data items to use to define a query for each report
object. You can use all the data items in the data source or a subset
of data items. Each data item is classified as either a category or
a measure.


Select Data Items
To select data items
to use in queries for the current report section:

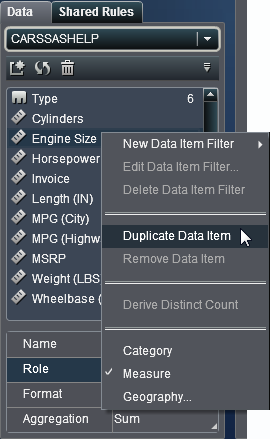
Duplicate Data Items
Duplicating data items
in SAS Visual Analytics Designer enables you to see the aggregations
of a data item (Sum, Average, Minimum, Maximum,
and Count) side-by-side in a table. If you
save a report with duplicate data items, then those data items are
available when you edit the report the next time.
You can duplicate a
calculated data item. You can also duplicate a category if you want
to it to be displayed using a different format.
To duplicate a data
item:
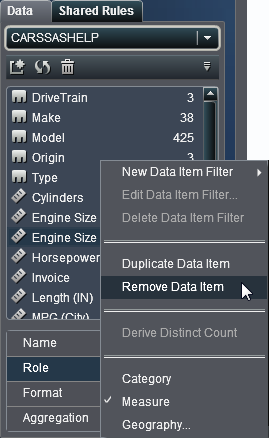
Remove Data Items
You can remove data
items, including calculated data items, so that they no longer appear
in the Data tab in the left pane.
You cannot remove the
last copy of a data item or a data item that is being used by a calculated
or a geography data item. You cannot remove a data item that is inside
a hierarchy, if it reduces the hierarchy to a single level.
To remove a data item
(or data items):

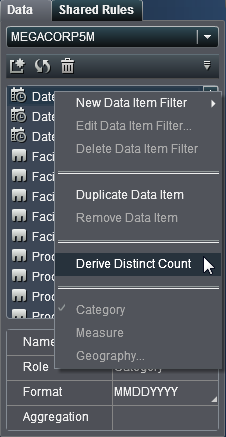
Derive a Distinct Count
A distinct count query
is useful in many ways. For example, you might want to know the number
of distinct products that were purchased during a specific time period.
Or you might want to know which products have the most customers or
which products have the most customers in a particular geographic
region. You can derive a distinct count for only a categorical data
item, including calculated category data items.
To derive a distinct
count:

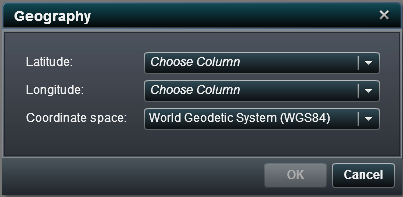
Create Geography Data Items
A geography data item
can be useful if your data contains values that are mapped to geographical
locations or regions. For example, a geography data item can identify
geographic information that is specific to your organization (for
example, sales regions, warehouse locations, oil platforms, and so
on).
If you change a numeric
measure into a geography data item, then it automatically becomes
a category data item.
To create a geography
data item:
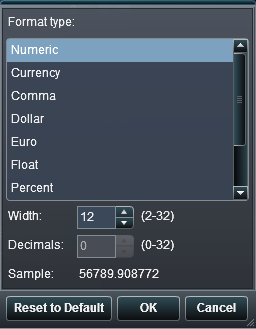
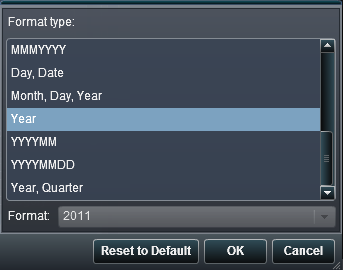
Modify Data Item Properties
Modify a Data Item’s Role

Modify the Format of a Measure or a Date-Time Data Item
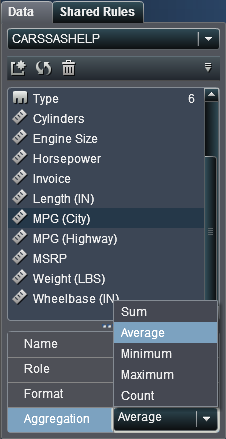
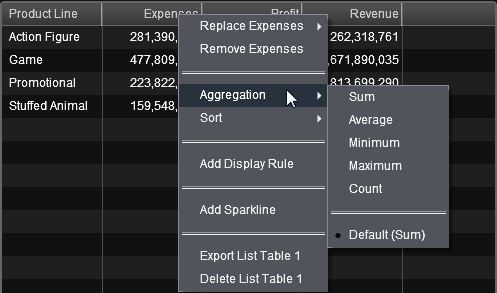
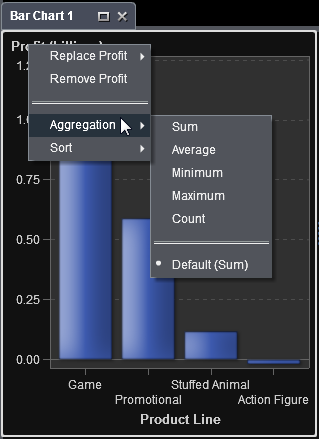
Modify How a Measure Is Aggregated
You can change the aggregation
method for a measure in a data source using either the Data tab
or in the canvas.
Note: You need to understand your
data, because some aggregation methods are not always appropriate.
For example, an average of an average is not valid.
To change the aggregation
method using the Data tab:
To change the aggregation
method when you are working with a report object in the canvas:
Copyright © SAS Institute Inc. All rights reserved.