Using Distinct Counts
About Distinct Counts
You can derive the distinct
count of a category as a new measure. The derived measure does not
contain data values in itself, but when it is used in a visualization,
it displays the number of distinct values for the data item that it
is based on.
Derive the Distinct Count for a Category or Date
To derive the distinct
count for a category or date, right-click a category or date in the
Data pane and then select Derive Distinct Count.
The derived measure appears automatically in the Data pane. The name
of the derived measure is identical to the category or date that it
is based on, with the suffix “(Derived).”
Explore Distinct Values in a Visualization
For bar charts, line
charts, treemaps, and geomaps, you can right-click a data point in
the visualization and then select Explore Distinct Values.
When you explore the distinct values, a new bar chart is created.
The new bar chart displays the values and the frequency of each value.
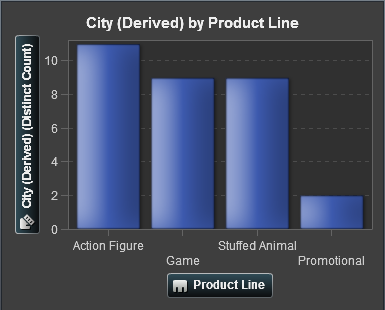
For example, you might
use a derived measure to create a bar chart that displays the number
of cities where each product line is produced:
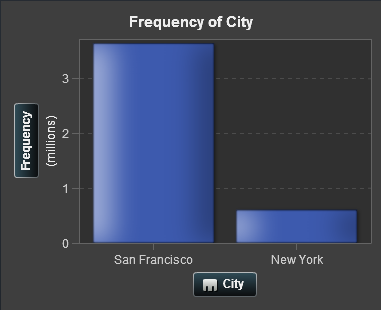
Then, you might want
to explore the distinct values for City where Promotional items are
produced. By right-clicking the bar for Promotional and selecting Explore
Distinct Values, you can see a new bar chart that contains
the cities where Promotional items are produced, and the frequency
of data for each city.
Copyright © SAS Institute Inc. All rights reserved.