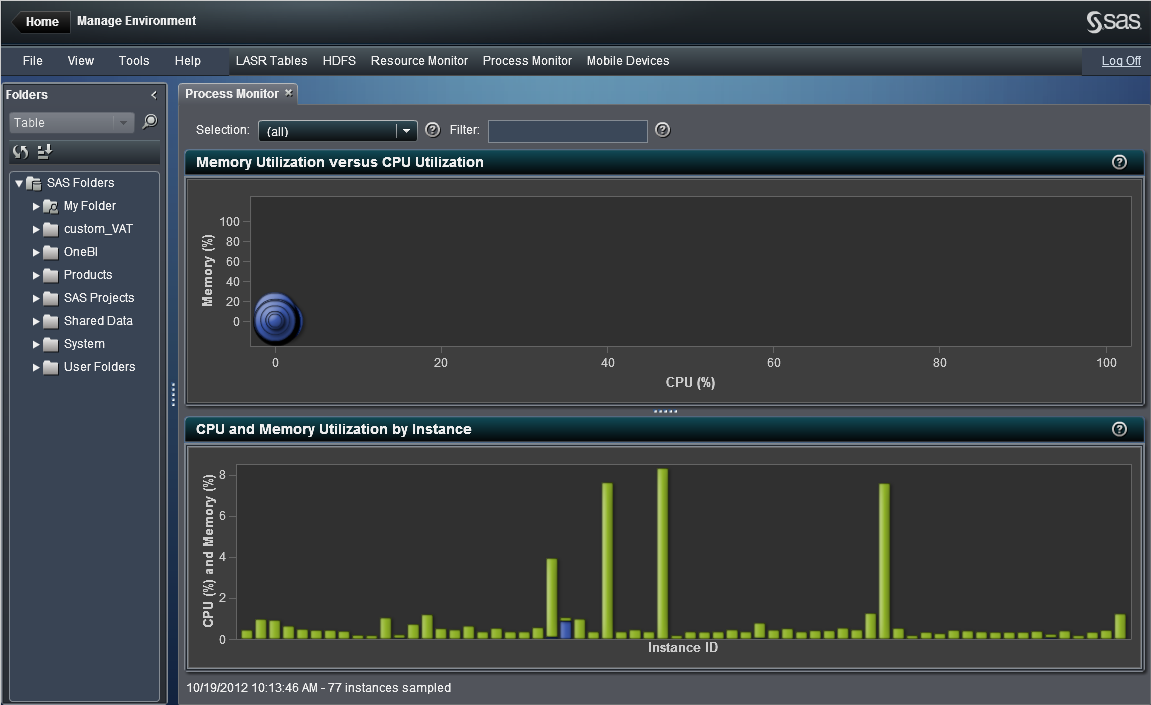
Viewing Memory and CPU Utilization
Information about the
per-process resource utilization is available in the Process
Monitor tab. The resource utilization for memory and
CPU are displayed in two graphs, the Memory Utilization
versus CPU Utilization and CPU and Memory
Utilization by Instance. The graphs are updated according
to a sampling rate. The sampling rate is set in the application preferences.
The Selection menu
enables you to filter the display of application instances in the
graphs for top resources consumers.
Each application instance
is represented by a bubble in the bubble plot. The size of the bubble
represents the number of processes used for the application instance.
If an instance has one process for each machine in the cluster, then
that ensures ideal resource utilization and performance.
The location of the
bubble indicates the resource utilization for the application instance
on the machines in the cluster. Place your pointer over a bubble to
view information about the application instance. Select a bubble to
view the detailed resource consumption for each machine that is used
by the application instance.
Process Monitor
Copyright © SAS Institute Inc. All rights reserved.