Overview of SAS Visual Analytics Explorer Interface
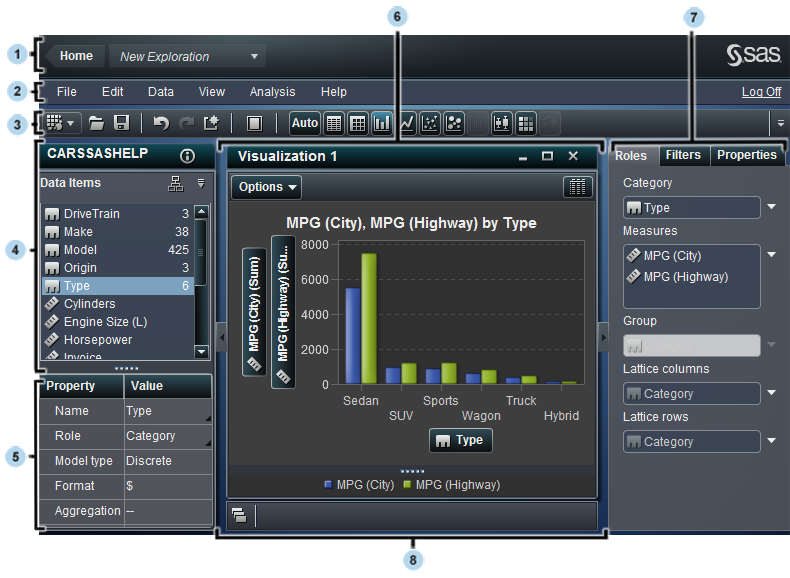
| 1 | The home bar enables you to return to the SAS Visual Analytics Home page and to select from your recent visual explorations. |
| 2 | The menu bar contains menus that enable you to perform tasks. |
| 3 | The toolbar contains icons that enable you to manage your visual explorations and visualizations. |
| 4 | The data pane enables you to manage the data that is used in your visualizations. |
| 5 | The data properties table enables you to manage the properties of the data item that is selected in the data pane |
| 6 | The workspace displays your visualizations. |
| 7 | The right pane contains tabs that enable you to change the properties of your visualizations, subset the data that is currently being used, and set the data roles for your visualizations. |
| 8 | The dock pane contains any visualizations that you have minimized and enables you to manage your visualizations. |