You can create interactions
using the interaction view or the
Interactions tab
in the right pane.
To create a filter
interaction using the interaction view:
-
Add the report objects
that you want to use to the report canvas. For
example, you might have a bar chart, a line chart, and a list table.
-
Click

above the canvas to switch to interaction view.
-
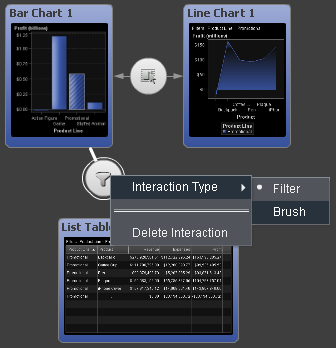
In the interaction view,
draw a connection between the source and target report objects. When
you have created an interaction, the

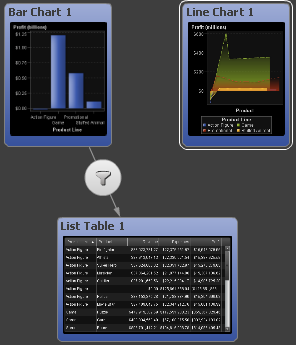
is displayed between the report objects. Here
is an example of an interaction between a bar chart (the source) and
a list table (the target):
Creating a Filter Interaction between a Bar Chart and a List
Table
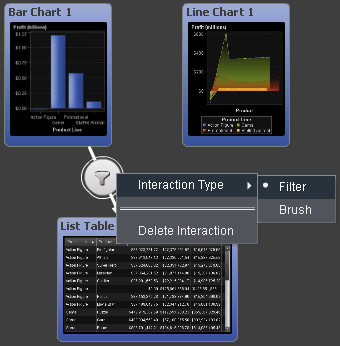
-
Right-click
. Then select
Interaction
Type Filter
.
-
(Optional) Add other
filter interactions.
-
Click

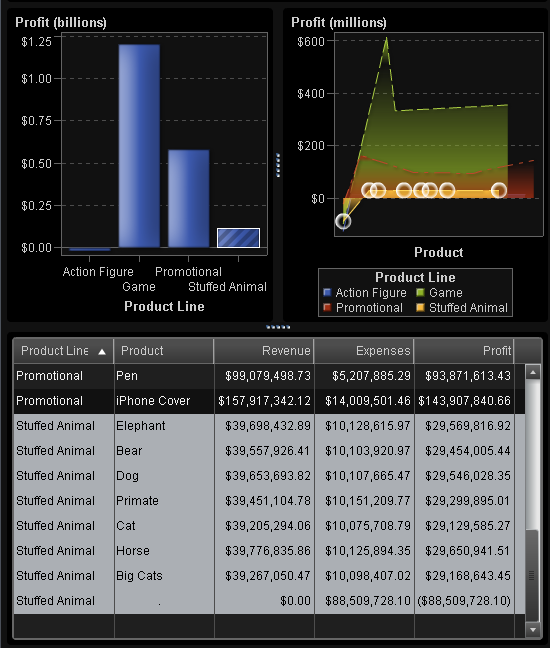
to switch to the layout view. Select data in the
source report object to filter data in the target report object (or
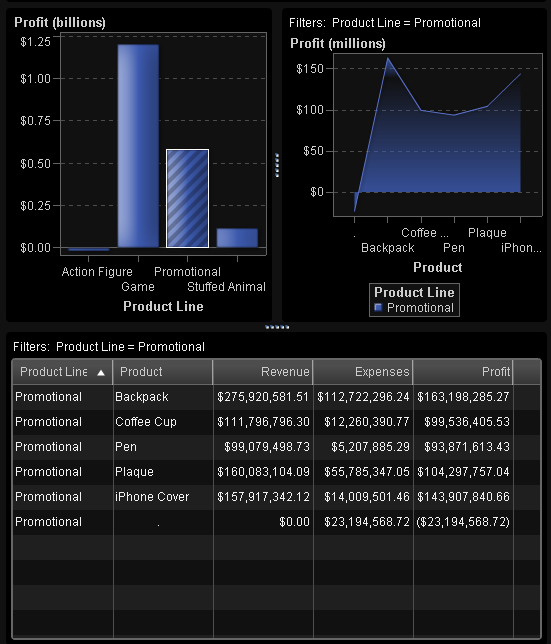
objects). In
the following example, the promotional product line was selected in
the bar chart. Simultaneously, the line chart and the list table show
the same filter.
A Filtering Example with a Bar Chart, a Line Chart, and a List
Table
To create an interaction
using the Interactions tab:
-
Select a report object
in the canvas. For example, you might have a bar chart.
-
Select the
Interactions tab.
-
Click

. The
Edit Interaction window
is displayed.
-
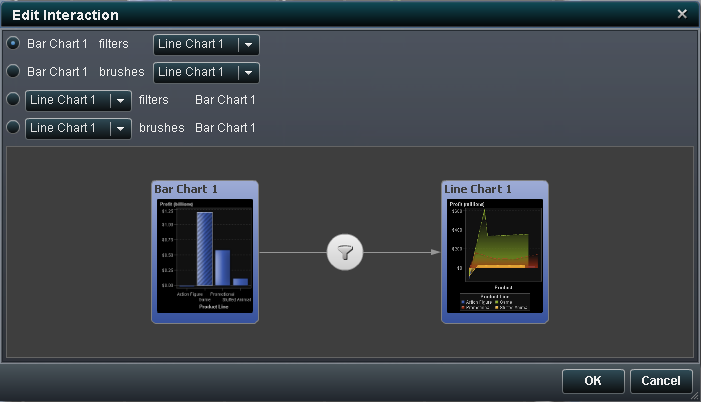
In the
Edit
Interaction window, select the report object that you
want as the source of a filter or brush interaction. For example,
if your report has a bar chart and you want it to filter a line chart,
the first line should read
Bar Chart 1 filters
Line
Chart 1.
-
When you are finished
working with interactions, click
OK.
-
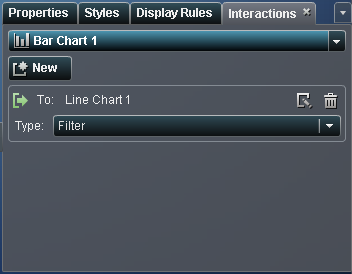
The new interaction
is displayed in the
Interactions tab.
A New Filter in the Interactions Tab