Using Data Items in a Query

About Data Items

Each data source includes one or more standard data items. You decide which data items to use to define a query for each report object. You can use all the data items in the data source or a subset of data items. Each data item is classified as either a category or a measure.
These data items are available in the designer interface:
Data Item
Icon
Description
Category
category icon
A data item whose distinct values are used to group and aggregate measures. There are four types of categories: alphanumeric, date, timestamp, and time. Alphanumeric categories can be made up of all letters, all digits, or a combination of the two. Categories that have values that are all digits might be physically stored as character or numeric data. The data type affects how values are handled in relation to some functionality, such as filtering, sorting, and formatting.
Examples of alphanumeric categories include data items such as Product ID, Country, Employee Number, and Employee Name.
Note: If you change a measure to a category, then it also uses this category icon.
Date and Time
date time icon
A category data item whose distinct values are used to group and aggregate measures. There are three types of date categories: date, timestamp, and time.
Examples of date, timestamp, and time categories are Order Year, Date of Sale, and Delivery Time.
Measure
measure icon
A data item whose values can be used in computations. These values are numeric. Examples of measures include Sales Revenue, Units Sold, and Salary.
The designer interface assigns a default aggregation method to every measure. Almost all measures are assigned sum, but certain formats are assigned an average. You can change the aggregation method.
Note: Report objects that are imported from the explorer interface use embedded data. Therefore, you have a very limited ability to make changes to these data items in the designer interface.

Select Data Items

To select data items to use in queries for the current report section:
  1. On the Data tab in the left pane, click the down arrow to display a list of available data sources. Select a data source and the Data tab is populated with a list of all of the data items that are in the data source.
    If the data source that you want is not in the list, click add data source icon, which displays the Add Data Source window. Select the data source that you want, and then click Add. The Data tab is populated with a list of all of the data items that are in the data source.
    If you do not want to use the data source that you originally selected, click Remove data source. A message box asks you to confirm that you want to remove the data source. Click Yes.
  2. (Optional) To see more information about a particular data item, select it in the list. The Name, Role, Format, and Aggregation are displayed in the data item table below the list of data items.
    Here is an example of the details for a data item called Engine Size:
    Details about a Selected Measure Data Item
    Details about a Selected Measure Data Item

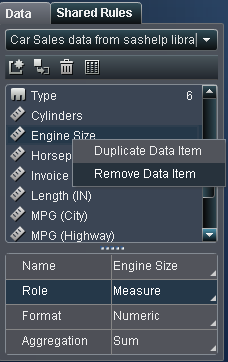
Duplicating Data Items
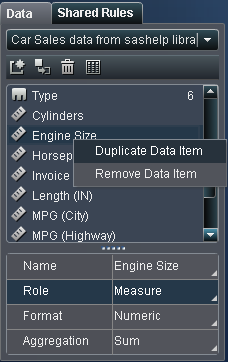
Duplicating data items enables you to see all the aggregations of a data item (Sum, Average, Minimum, Maximum, and Count) side-by-side in a table. If you save a report with duplicate data items, then those data items are available when you edit the report the next time.
To duplicate a data item:
  1. On the Data tab in the left pane, right-click the data item that you want to duplicate.
    Duplicate Data Item Menu Selection
    Duplicate Data Item Menu Selection
  2. Select Duplicate Data Item. The data item appears in the list of data items. For example, if the original data item name is Engine Size, then the duplicate data item is displayed as Engine Size (1). If you choose to duplicate the same data item again, then it is displayed as Engine Size (2).
  3. (Optional) Rename the duplicate data item (or data items).

Removing Data Items

You can remove data items so that they do not appear in the Data tab in the left pane. This means that the data item (or data items) are removed when you open that data source. If an administrator removes the data source and then adds it back, then the deleted data items appear again. If you save a report with deleted data items, then those data items are not available the next time you edit the report.
To remove a data item (or data items):
  1. On the Data tab in the left pane, right-click the data item that you want to remove.
    Remove Data Item Menu Selection
    Remove Data Item Menu Selection
  2. Select Remove Data Item. The data item is removed from the list of data items.

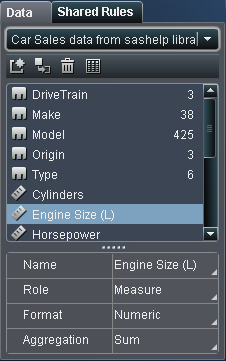
Modifying Data Item Properties

Rename a Data Item

To rename a data item:
  1. Select a data item on the Data tab.
  2. In the data item table, select the existing name for the data item and then enter a new name. Your change is saved automatically.

Modify a Data Item’s Role

To modify a data item’s role:
  1. Select a data item on the Data tab.
  2. In the data item table, select the existing role name for the data item. In the drop-down menu, select either Measure or Category. Select one and your change is saved automatically.
    Note: Categories data items cannot be converted into measure data items.

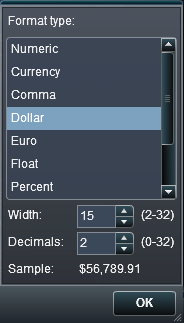
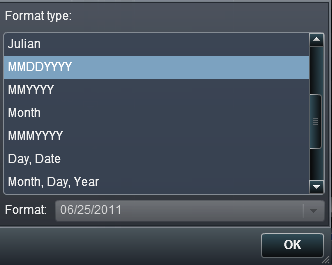
Modify the Format of a Measure or a Date-Time Data Item

To change the format of a measure or date-time data item:
  1. Select a measure data item on the Data tab.
  2. In the table, select the existing format. A list is displayed with the Format type, Width, and Decimals. Make your selections. A sample of your selection (or selections) is displayed under the list. Here is an example of the list:
    Available Formats for a Measure Data Item
    Available Formats for a Measure Data Item
    Available Formats for a Date–Time Data Item
    Available Formats for a Date-Time Data Item
  3. Click OK to save your changes.

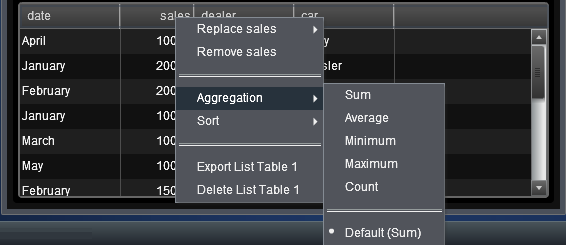
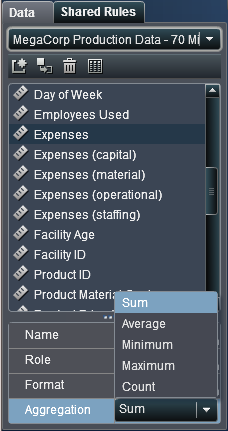
Modify How a Measure Is Aggregated

You can change the aggregation method for a measure in a data source using either the Data tab or in the canvas.
Note: You need to understand your data, because some aggregation methods are not always appropriate. For example, an average of an average is not valid.
To change the aggregation method using the Data tab:
  1. Select a measure data item on the Data tab.
  2. In the data item table, select the existing aggregation. A drop-down list is displayed with aggregations. Sum, Average, Minimum, Maximum, and Count are the available aggregations. Select one, and your change is saved automatically.
    Available Aggregations for a Data Item
    Available Aggregations for a Data Item
To change the aggregation method when you are working with a report object in the canvas:
  1. Right-click a measure data item in the report object.
    Aggregation Menu Items
    Aggregation Menu Items
  2. Select Aggregationthen selectaggregation name, where aggregation name is Sum, Average, Minimum, Maximum, and Count. Select one, and your change is saved automatically.