To create an interaction
using data brushing:
-
Add the report objects
that you want to use to the canvas. For example, you might have a
bar chart, a pie chart, and a crosstab.
-
Click

above the canvas to switch to interaction mode.
-
In the interaction view,
draw a connection between the source and target report objects. When
you have created an interaction, the

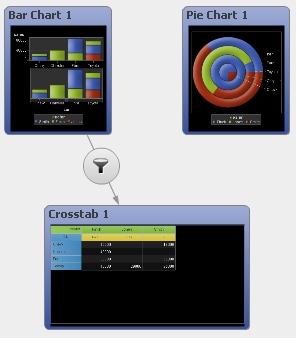
is displayed between the report objects. Here is
an example of a data brushing interaction between a bar chart (the
source) and a crosstab (the target):
Creating a Data Brushing Interaction between a Bar Chart and
a Crosstab
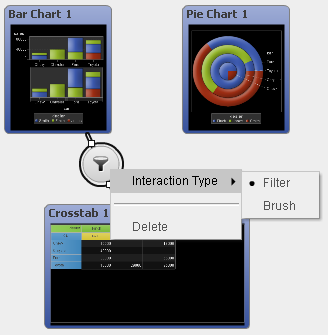
-
Right-click
. Then select
Interaction
Type Brush
Brush.
The filter icon changes
to

.
-
(Optional) Add other
data brushing interactions.
-
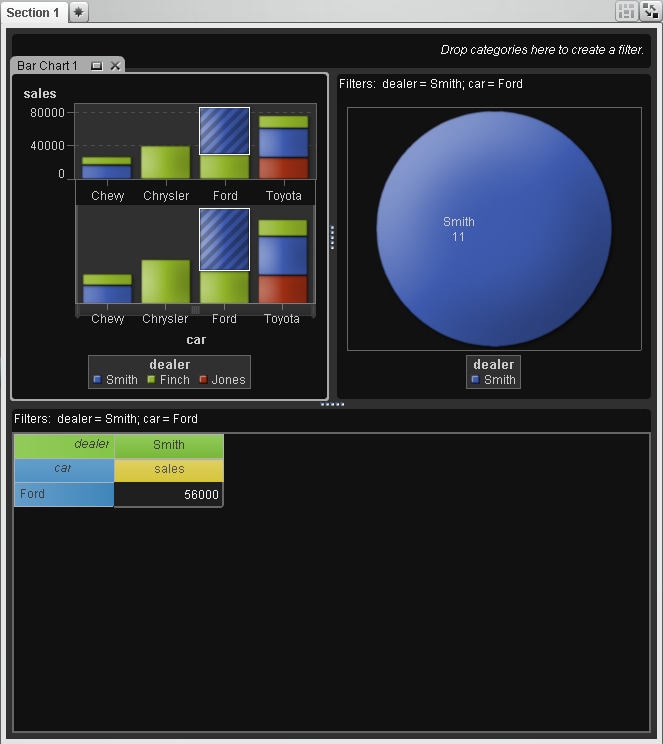
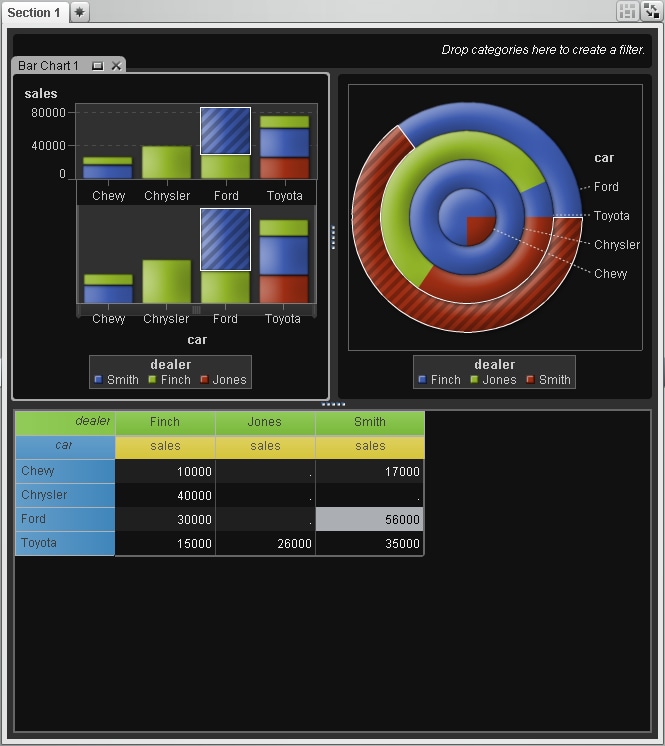
Click

to switch to the layout view. Select data in the
target report object to brush data in the connected report object
(or objects). In the following example, the Smith car dealership was
selected in the bar chart. Simultaneously, the pie chart and the crosstab
show the same data brushing.
A Data Brushing Example with a Bar Chart, a Pie Chart, and
a Crosstab