The Data Builder
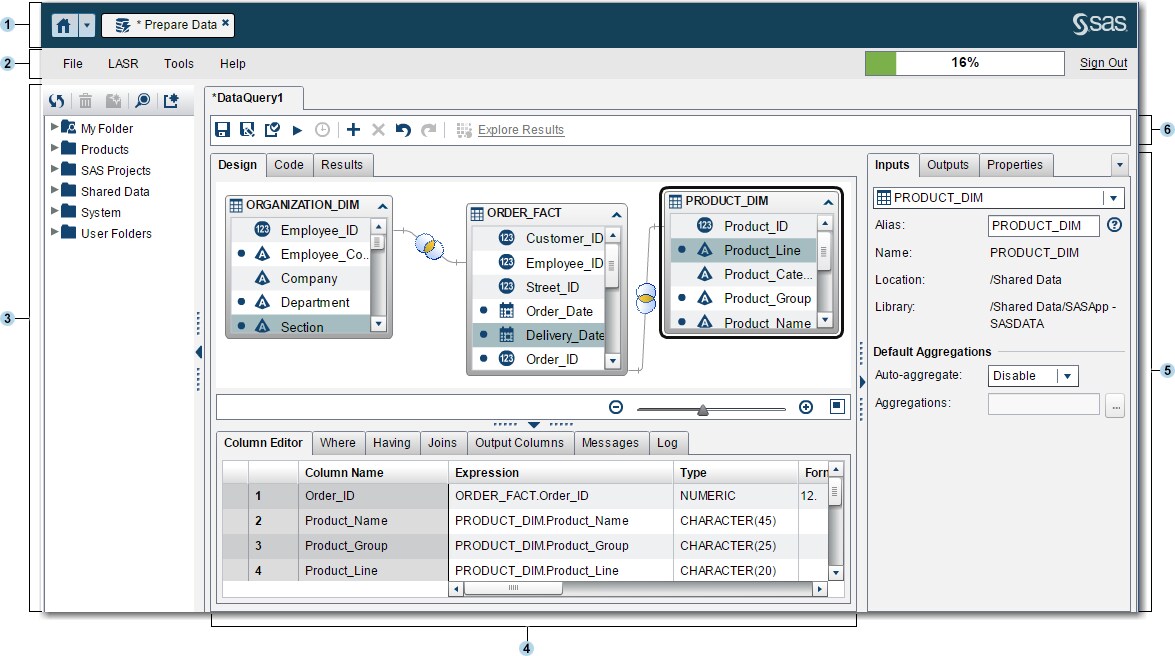
| 1 | The application bar enables you to return to the home page and to access other parts of SAS Visual Analytics and other SAS applications that integrate with the home page. |
| 2 | The menu bar contains menus that enable you to perform tasks such as creating new data queries and LASR star schemas. The right side of the menu bar has a memory gauge that displays the memory utilization for a distributed SAS LASR Analytic Server. You can also sign out of SAS Visual Analytics. |
| 3 | The navigation pane displays a tree (the SAS Folders tree) of tables and data queries. |
| 4 | The
center of the screen contains the workspace. When you create a new
object, such as a data query, it is represented as a tab on the top
of the workspace.
The bottom of the workspace
contains a series of tabs that enable you to create column expressions,
joins, and filter data.
|
| 5 | The right pane enables you to manage the properties of the item that is selected in the workspace. |
| 6 | The toolbar contains icons that enable you to manage, run, and schedule data queries. |
Copyright © SAS Institute Inc. All rights reserved.