Create a Decision Tree
A decision tree creates
a hierarchical segmentation of the input data based on a series of
rules applied to each observation. Each rule assigns an observation
to a segment based on the value of one effect. Rules are applied sequentially,
which results in a hierarchy of segments within segments.
To create the decision
tree for this example, complete the following steps:
-
Click
 to create a new visualization.
-
Click
 to specify that this visualization is a decision
tree.
to specify that this visualization is a decision
tree.
-
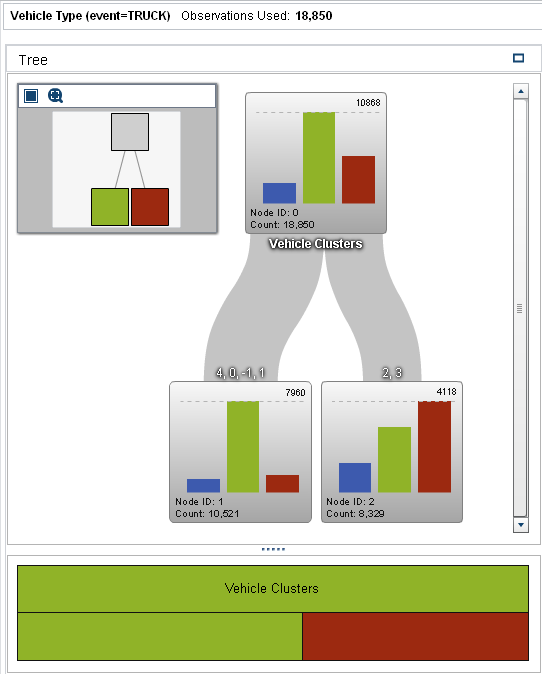
Drag and drop the variable Vehicle Type into the Response field on the Roles tab.At this point, there is only a single node in your decision tree. The predicted value for this node is CAR because it is the most frequent measurement level in that node.
-
On the Roles tab, click Advanced. Select TRUCK as your event level. Click OK.This selection indicates that you want to predict whether an observation is a truck for model comparison purposes. The two other measurement levels are grouped together as not trucks.
-
Select the Properties tab in the right pane. For Maximum levels, specify
2.Select Show diagnostic plots. In the Assessment window, select the Misclassification plot. Observe this plot as you make changes to the decision tree to see how well your model classifies the data.Enabling this property ensures that the smallest possible decision tree is created when you add predictors to the tree. In the following steps, you add a variety of predictors to the tree and interactively train the tree. -
Drag and drop the variables Vehicle Clusters, Vehicle Axle Ratio, Vehicle Cylinders, Vehicle EngineSize (l), Vehicle Gears, Vehicle Horsepower, and Vehicle MPG onto the visualization. A two-level decision tree is created.
-
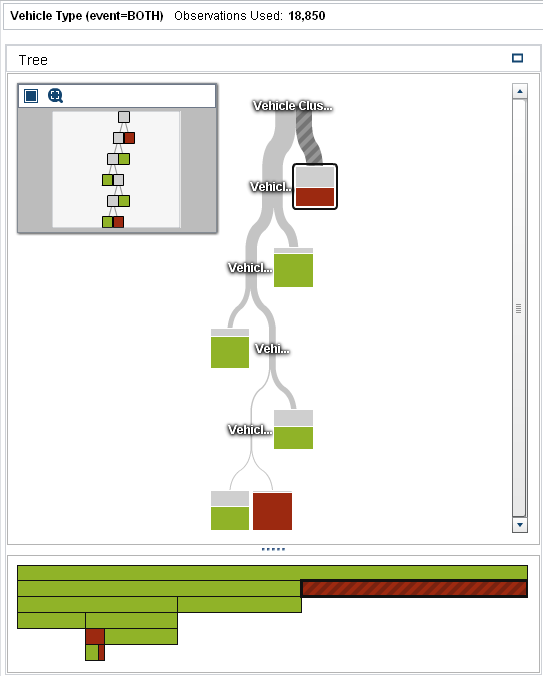
Select the leaf node that contains vehicle clusters 4, 0, -1, and 1. Right-click on this node, and select Train. The Train Decision Tree window appears.The variable Vehicle EnglineSize (l) is automatically selected for training because it has the greatest log worth of all the variables. Maximum depth of subtree is set to 6, which indicates that up to six additional levels can be added to the current decision tree. Click OK.
-
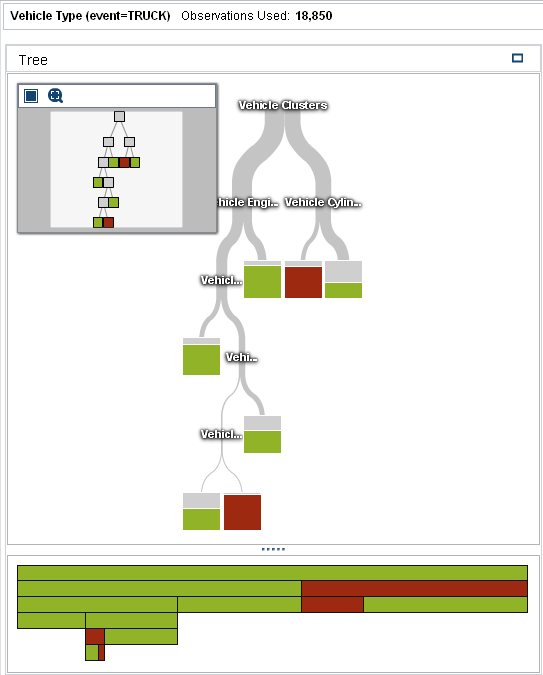
Select the node that contains only vehicle clusters 2 and 3. Right-click on this node, and select Train. The Train Decision Tree window appears.The variables Vehicle EngineSize (l), Vehicle Clusters, and Vehicle Cylinders all have an equal log worth. Select Vehicle Cylinders, and click OK.Only one additional level is added to the decision tree. Check the Misclassification plot in the Assessment window to confirm that the number of misclassifications decreased.
-
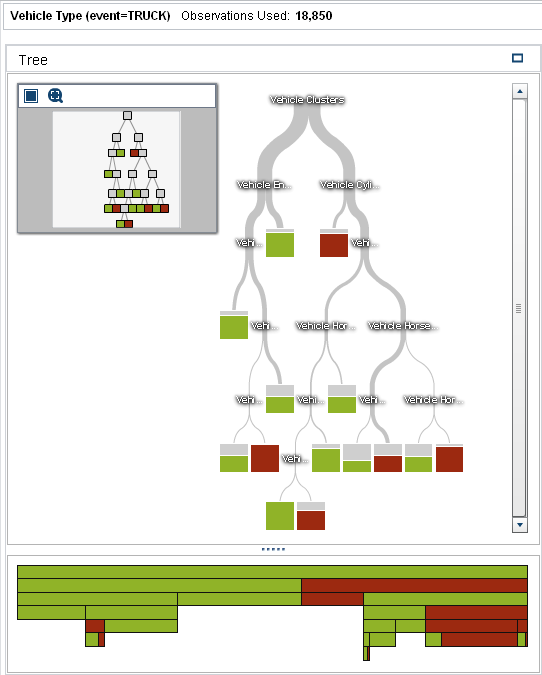
Repeat the training for node 12, which is the node that contains vehicle clusters 2 and 3 and in which vehicle cylinders is less than 6.1. Right-click on this node, and select Train. Vehicle Horsepower has the greatest log worth, so select it, and click OK.Zoom out to view the full tree. Your final decision tree should resemble the following image:
-
Save the exploration.
Copyright © SAS Institute Inc. All Rights Reserved.
Last updated: August 16, 2017