The Explorer User Interface
The Explorer
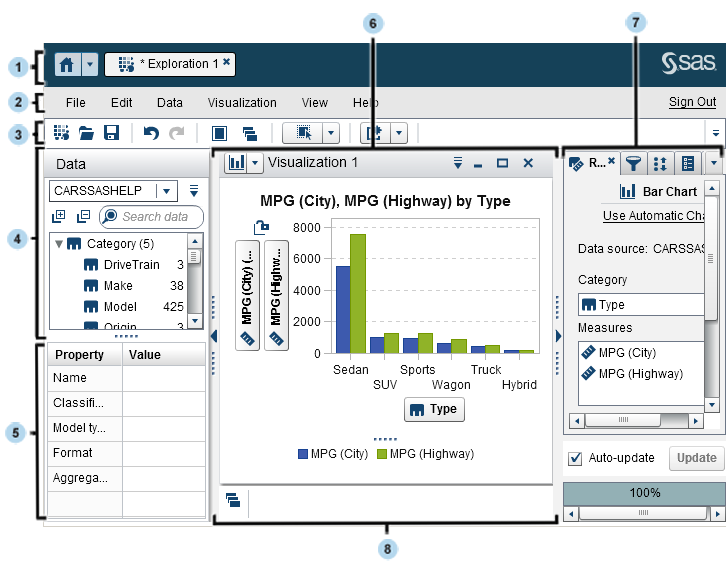
| 1 | The application bar enables you to return to the home page and to access other parts of SAS Visual Analytics and other SAS applications that integrate with the home page. You can access your recently created or viewed reports, explorations, stored processes, data queries, or other objects in your recent history. Buttons are displayed for each open application. |
| 2 | The menu bar offers common tasks, such as creating a new exploration. |
| 3 | The toolbar enables you to manage your explorations and visualizations. |
| 4 | The Data pane enables you to manage the data that is used in your visualizations. |
| 5 | The data properties table enables you to set data item properties. |
| 6 | The workspace displays one or more visualizations. |
| 7 | The right pane’s tabs enable you to set properties and data roles, create filters and ranks, set global parameter values, and use comments. |
| 8 | The dock contains any minimized visualizations. |
Menus and Toolbars
From the SAS Visual
Statistics main menu, you are able to access all of the features of
the application.
The SAS Visual Statistics toolbar
enables you to quickly access frequently used tasks:
|
Icon
|
Description
|
|---|---|
 |
Creates a new exploration.
|
 |
Maximizes the modeling
workspace.
|
 |
Returns the modeling
workspace to the default view.
|
 |
Creates a linear regression
model.
|
 |
Creates a logistic regression
model.
|
 |
Creates a generalized
linear model (GLM).
|
 |
Creates a decision tree
model.
|
 |
Creates a cluster model.
|
 |
Compares two or more
models.
|
The Data Pane
The Data pane
enables you to access all of the variables in your data set. Variables
are sorted into Category and Measure variable
groups. By default, character variables are considered category variables
and numeric variables are considered measure variables. Numeric variables
with a finite number of levels can be converted into category variables.
You can create variable
interactions and calculated items in the Data pane.
When you enter something
into the Search data field, only those variables
that contain the search term are displayed. Search terms are not case
sensitive.
To collapse the variable
groups, click  to the left of the Search data field.
To expand the variable groups, click
to the left of the Search data field.
To expand the variable groups, click  to the left of the Search data field.
to the left of the Search data field.
To expand the variable groups, click to the left of the Search data field.
The Data pane
drop-down list icon,  , is located in the upper right corner of the Data pane.
The following items are of interest, but not a complete list of options:
, is located in the upper right corner of the Data pane.
The following items are of interest, but not a complete list of options:
, is located in the upper right corner of the Data pane.
The following items are of interest, but not a complete list of options:
-
New Interaction Effect enables you to create interaction effects to use in your visualizations.
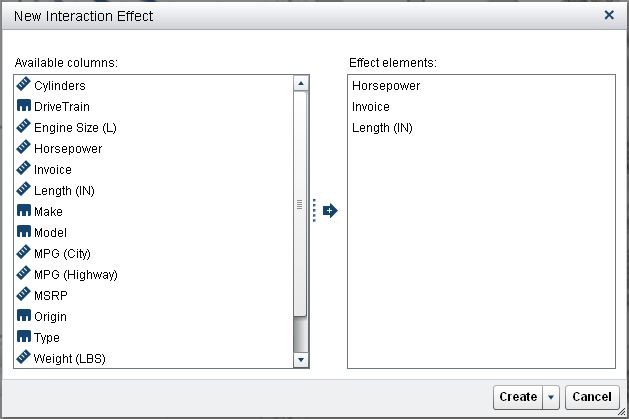 In the New Interaction Effect window, you move variables from the Available columns area to the Effect elements area. You can drag and drop a variable, double-click a variable, or use the arrows in the center of the window. After you have moved variables to the Effect elements area, click Create to create a single interaction. Alternatively, click
 to specify whether you want to Create
one interaction or Create two-way interactions.
When you choose Create two-way interactions, all of the possible pairs of interactions for the selected variables are created, except for square terms. To create a square term, move two copies of a variable into the Effect elements area, and click Create.
to specify whether you want to Create
one interaction or Create two-way interactions.
When you choose Create two-way interactions, all of the possible pairs of interactions for the selected variables are created, except for square terms. To create a square term, move two copies of a variable into the Effect elements area, and click Create. -
Data Properties displays the name, classification, data type, model type, and format for each variable in the data set.
-
Measure Details opens the Measure Details window. The Measure Details window provides summary statistics and a histogram for each of the measure variables.
-
Show/Hides Items enables you to specify what variables are displayed in the Data pane. Variables in the Visible items area are displayed in the Data pane. Variables in the Hidden items area are not displayed.To move variables from one area to the other, drag and drop the variable, double-click a variable, or use the arrows in the center of the window. You can move multiple variables by selecting them first, and then either dragging and dropping them or using the arrows.Click OK to close the Show or Hide Items window and save your changes.
-
Sort Items enables you to specify whether you want to sort the variables in ascending or descending order.
The Right Pane
The right pane contains
the Roles, Properties,
and Filters tabs. Together, these three tabs
define the modeling parameters. The Roles tab
specifies what variables are used in the model and their purposes
in the model. The Properties tab enables
you to specify features that are unique to each model. The Filters tab
enables you to subset the data that is modeled.
|
Tab
|
Description
|
|---|---|
 Roles
|
Enables you to add variables
to your model.
From the Data pane,
drag and drop a variable that you want to use to a role on the Roles tab.
Alternatively, you can select several variables and drag and drop
them onto the model pane. In this case, each variable is assigned
to the first valid and available role.
If there is no response
variable, then the first valid variable is assigned to the Response role.
This method never assigns Group By, Frequency, Filter,
or Weight variables. You can use the
icon to add or remove variables from each individual
field.
|
 Filters
|
Enables you to specify
variables that are used to filter the data set. You can filter on
category variables, measure variables, or both. To add a filter variable,
drag and drop that variable from the Data pane
to the Filters tab or use the
icon. To remove a filter variable, click  next to that variable’s name. next to that variable’s name.
|
 Ranks
|
Enables you to specify
rank variables. Rank variables subset the data in your visualization
to display either the top or the bottom aggregated value for a category.
To add a rank variable, drag and drop that variable from the Data pane
onto the Ranks tab.
|
 Properties
|
Enables you to specify
features of the model. The available options vary based on the selected
model.
|
 Comments
|
Enables you to enter
comments about the current model.
|
 Parameters
|
Enables you to view
any parameters that affect a calculated item that is used by the current
model.
|
The Model Pane
The model pane contains
the modeling results and plots. Because the windows available depend
on the selected model, this section focuses on the common elements
for all models. Specific information for each model is available in
the SAS Visual Analytics: User’s Guide.
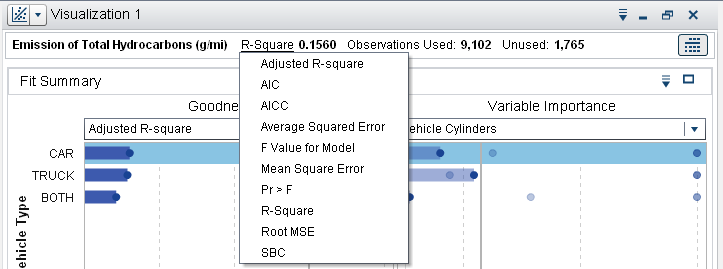
The summary bar displays
the response variable, model evaluation criterion (when available),
and the number of used and unused observations in the model. To see
all of the available model evaluation criteria, click the name of
the current model evaluation criterion in the summary bar to open
a pop-up menu.
On the right side of
the summary bar, there is the  icon. Click to open the details table at the bottom of the model
pane.
icon. Click to open the details table at the bottom of the model
pane.
icon. Click to open the details table at the bottom of the model
pane.
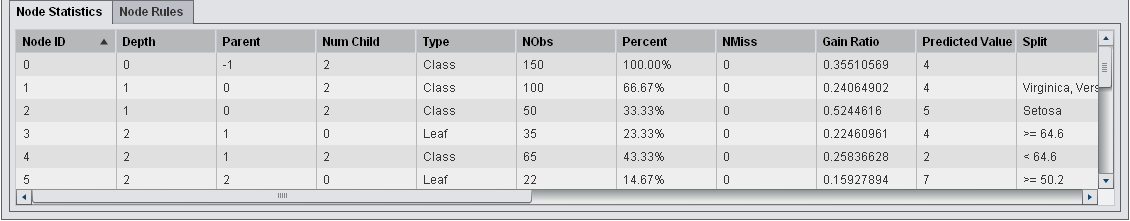
An example details
table from a decision tree model is shown below. The specific information
in each details table varies based on the model.
To maximize a window,
click  . This hides all of the other windows in the model
pane, but does not hide the details table. To restore the default
view, click
. This hides all of the other windows in the model
pane, but does not hide the details table. To restore the default
view, click  .
.
. This hides all of the other windows in the model
pane, but does not hide the details table. To restore the default
view, click .
The Gallery contains a sample screenshot and description for each window.
|
Window Name
|
Available In
|
|---|---|
|
Fit Summary
|
Linear, Logistic, GLM
|
|
Residual
Plot
|
Linear, Logistic, GLM
|
|
Assessment
|
Linear, Logistic, GLM,
Decision Tree
|
|
Influence
Plot
|
Linear and Logistic
|
|
Tree
|
Decision Tree
|
|
Leaf Statistics
|
Decision Tree
|
|
Cluster
Matrix
|
Cluster
|
|
Parallel
Coordinates
|
Cluster
|
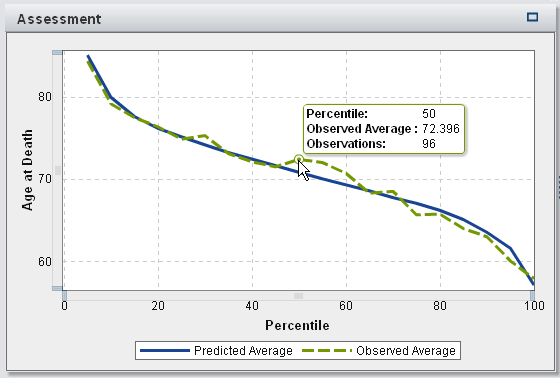
In every window, if
you position your mouse pointer over an object, a tooltip provides
specific information about that object. The information varies based
on the plot that is displayed. For example, in the following image,
the tooltip shows the percentile (in the bin), observed average value
in that bin, and the number of observations in that bin.
Whenever a range of
values is shown or selected, the interval is half-open. The minimum
value is included in the interval. The maximum value is excluded from
the interval. This affects heat maps, the parallel coordinates plot,
and any other displayed or selected interval.
Copyright © SAS Institute Inc. All Rights Reserved.
Last updated: August 16, 2017