Create a Linear Regression
A linear regression
attempts to predict the value of a measure response variable as a
linear function of one or more effects. The linear regression model
uses the least squares method to determine the model.
To create the linear
regression for this example, complete the following steps:
-
Click
 to create a new visualization.
-
Click
 to specify that this visualization is a linear regression.
-
Drag and drop the variable Emission of Total Hydrocarbons (g/mi) into the Response field on the Roles tab.
-
Drag and drop the variables Vehicle Clusters, Vehicle Manufacturer, Test Procedure, Vehicle Cylinders, Vehicle MPG, Vehicle Gears, and Vehicle Weight (lbs) onto the visualization. SAS Visual Analytics automatically creates a linear regression model using these variables as the effects.
-
Drag and drop the variable Vehicle Type into the Group By field on the Roles tab. This specifies that Vehicle Type is the segmentation variable.The results windows are updated. Instead of creating one model for the entire input data set, separate models are created for each measurement level of the group by variable. In this example, that means that separate models were created based on a vehicle’s classification as a car, a truck, or both.
-
Select the Properties tab in the right pane. Select Informative missingness. Enabling this property indicates that missing values are used in the model.
-
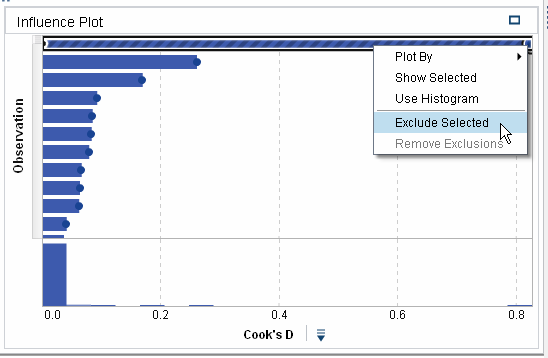
In the Fit Summary window, click the CAR segment.In the Influence Plot, Cook’s D is the default influence statistic. Notice that the first bar in this plot is significantly larger than all the other bars. From this, you can guess that the observations represented by this bar are outliers, and you should exclude them from the model.To exclude these observations, click the bar to select it. Right-click the bar, and select Exclude Selected.
 The model for the CAR segment is updated to account for the excluded observations.
 -
Save the exploration.
Copyright © SAS Institute Inc. All Rights Reserved.
Last updated: August 16, 2017