Distributed Server: Monitoring
Memory Gauges
For a distributed server,
an overall memory gauge is displayed in the main menu bar in the administrator.
The overall gauge indicates how much of the server host’s total
physical memory is currently in use. The overall gauge is refreshed
every minute.

Here are some details:
-
If a specified percentage of memory is used, a distributed server rejects requests to load tables or append rows. See Memory Limits.
-
The gauge provides information for only the distributed server that is referenced in the service.properties file in the SAS configuration directory (at
/Applications/SASVisualAnalytics/HighPerformanceConfiguration).Note: This constraint also applies to additional memory usage information for distributed servers (on the Monitor tabs and the LASR Servers tab). -
For a distributed server, individual memory gauges are displayed in the Virtual Memory column on the LASR Servers tab. Each individual gauge indicates how much of the cluster’s total virtual memory is being used by a particular server instance (process). The individual gauges are refreshed every minute after the LASR Servers tab is opened.Note: The calculation behind the overall memory gauge differs from the calculation behind the individual memory gauges. For details, see Memory Usage: A Closer Look.
Resource Monitor
For
a distributed server, you can monitor resource utilization by selecting LASR Monitor Resources from the main menu in the administrator.
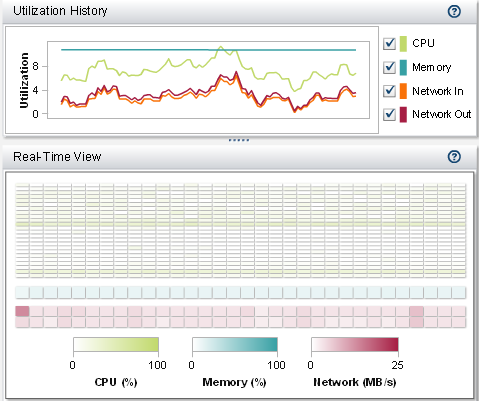
In the upper half of
the Resource Monitor tab, the Utilization
History graph plots utilization against time as follows:
-
CPU and memory utilization are plotted as percentages of capacity. Under high demand, the upper bound can reach 100%. Under low demand, the upper bound can drop below 10%.
-
Network input and output utilization is displayed as two line plots. The plots show the transfer rate in megabytes per second.
To view resource utilization
for a particular sampling period, place your pointer over a line.
To select that sampling period in the entire display, click a line.
You can then place your pointer over the sampling period on each line
to view details.
In the lower half of
the Resource Monitor tab, the Real-Time
View heat map contains a column for each machine in the
cluster. To view the host name and details, place your pointer over
a cell.
-
The top and middle sections show CPU utilization and memory utilization, respectively. The color reflects the workload (more saturated color indicates heavier use).
-
The bottom section shows network output transfer rate (in the first row) and network input transfer rate (in the last row). The color reflects the transfer rate between 0 and 25 megabytes per second. If the transfer rate exceeds 25 MBps, the color is purple.
Process Monitor
For
a distributed server, you can monitor per-process utilization by selecting LASRMonitor Processes from the main menu in the administrator.
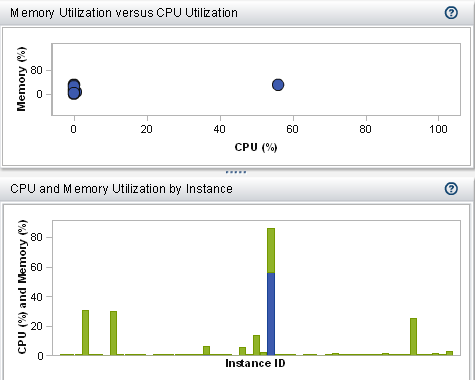
At the top of the Process
Monitor tab, the Selection and Filter controls
enable you to specify which server instances to display.
The Process
Monitor tab displays two graphs:
-
Memory Utilization versus CPU UtilizationEach server instance is represented by a bubble. The size of the bubble represents the number of processes for that instance. The location of the bubble indicates the resource utilization for that instance. Ideally, an instance has one process for each machine in the cluster.
-
CPU and Memory Utilization by InstanceEach bar shows CPU and memory utilization for a server instance. If a bar is vertically divided, CPU utilization is shown in the lower section, and memory utilization is shown in the upper section.
To view details, place
your pointer over a bubble or a bar. For machine-level information,
click on a bubble or bar. A window lists host names, ranks the hosts
(by the column that you most recently sorted), and shows used memory
and CPU. For table-level information, click Show tables within
the window. The window lists loaded tables, the user ID of the person
who loaded them, and the number of rows and columns in each table.
Note: Per-process utilization is
calculated from the traditional systems perspective. See the following
section.
Memory Usage: A Closer Look
For
a distributed server, the administrator provides two distinct expressions
of memory usage:
-
In the main menu bar, the overall memory gauge provides a practical estimate of effective capacity.The value for the overall memory gauge is calculated as follows:
(total allocations - SASHDAT allocations) / (total memory for the cluster)
total allocations all memory allocations for all processes on the cluster. SASHDAT allocations memory that is allocated for tables that have been loaded from HDFS. These tables are stored in a highly efficient manner that keeps them instantly available on demand but consumes memory only when the data is accessed. For this reason, the overall gauge does not count SASHDAT allocations as used memory. -
In the Virtual Memory column on the LASR Servers tab, each individual gauge indicates how much memory is currently being used by a particular server instance (process).The individual gauges express memory usage from the traditional systems perspective, disregarding the memory-sparing efficiencies of SASHDAT allocations. The individual gauges can help you analyze capacity for the hypothetical scenario in which all tables are accessed simultaneously.The value for each individual gauge is calculated as follows:
(total allocations for this instance) / (total memory for the cluster)
Note: The per-instance information about the Process Monitor tab also uses the preceding calculation to express memory usage.
Tip
On the LASR Servers tab,
the sum of the individual gauges matches the overall memory gauge
only if there are no SASHDAT allocations.
Copyright © SAS Institute Inc. All Rights Reserved.
Last updated: December 18, 2018