This example uses the
Text
Cluster node to cluster SAS Users Group International
(SUGI) abstracts. This example assumes that SAS Enterprise Miner is
running, and that a diagram workspace has been opened in a project.
For information about creating a project and a diagram, see
Setting Up Your Project.
Note: SAS Users Group International
is now SAS Global Forum.
Perform the following
steps:
-
Create a data source
for SAMPSIO.ABSTRACT. Change the Role of the variable TITLE to
ID.
Note: The SAMPSIO.ABSTRACT data
set contains information about 1,238 papers that were prepared for
meetings of SUGI from 1998 through 2001 (SUGI 23 through 26). The
variable TITLE is the title of the SUGI paper. The variable TEXT contains
the abstract of the SUGI paper.
-
Add the SAMPSIO.ABSTRACT
data source to the diagram workspace.
-
Select the
Text
Mining tab on the Toolbar, and drag a
Text
Parsing node into the diagram workspace.
-
Connect the
Input
Data node to the
Text Parsing node.
-
Select the
Text
Parsing node, and then click the

for the
Stop List property.
-
Click the
Import button,
browse to select SAMPSIO.SUGISTOP as the stop list, and then click
OK.
Click
OK to exit the dialog box for the
Stop
List property.
-
Set the
Find
Entities property to
Standard.
-
Click the
for the
Ignore Types of Entities property
to open the
Ignore Types of Entities dialog
box.
-
Select all entity types
except for:
Location,
Organization,
Person,
and
Product. Click
OK.
-
Select the
Text
Mining tab, and drag a
Text Filter node
into the diagram workspace.
-
Connect the
Text
Parsing node to the
Text Filter node.
-
Select the
Text
Mining tab, and drag a
Text Cluster node
into the diagram workspace.
-
Connect the
Text
Filter node to the
Text Cluster node.
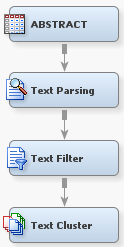
Your process flow diagram should resemble the following:
-
Right-click the
Text
Cluster node and select
Run.
Click
Yes in the
Confirmation dialog
box.
-
Click
Results in
the
Run Status dialog box when the node has
finished running.
-
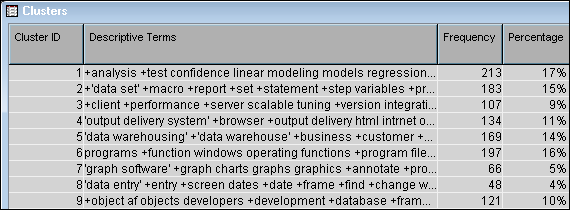
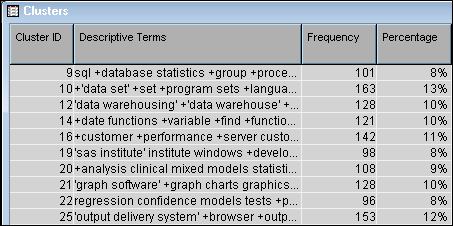
Select the
Clusters table.
The
Clusters table
contains an ID for each cluster, the descriptive terms that make up
that cluster, and statistics for each cluster.
-
Select the first cluster
in the
Clusters table.
-
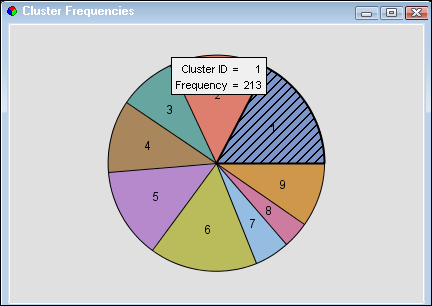
Select the
Cluster
Frequencies window to see a pie chart of the clusters
by frequency. Position the mouse pointer over a section to see the
frequency for that cluster in a tooltip.
-
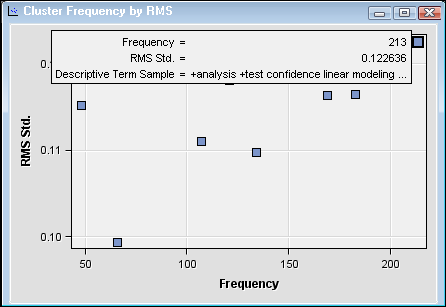
Select the
Cluster
Frequency by RMS window, and then position the mouse
pointer over the highlighted cluster.
The frequency of the
first cluster is the highest, but how does it compare to the other
clusters in terms of distance?
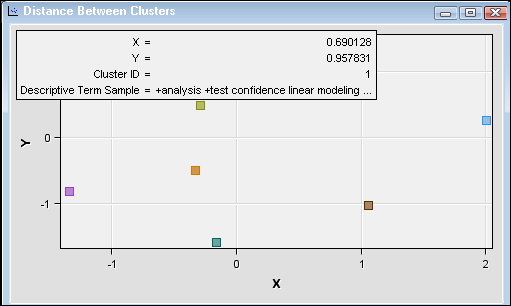
-
Select the
Distance
Between Clusters window. Then position the mouse pointer
over the highlighted cluster to see the position of the first cluster
in an X and Y coordinate grid.
Position the mouse pointer
over other clusters to compare distances.
-
Close the
Results window.
Now compare the clustering
results that were obtained with the Expectation-Maximization clustering
algorithm with using a Hierarchical clustering algorithm.
-
Select the
Text
Cluster node.
-
Select
Exact for
the
Exact or Maximum Number property.
-
Specify
10 for
the
Number of Clusters property.
-
Select
Hierarchical for
the
Cluster Algorithm property.
-
Right-click the
Text
Cluster node and select
Run.
Click
Yes in the
Confirmation dialog
box.
-
Click
Results in
the
Run Status dialog box when the node has
finished running.
-
Select the
Clusters table.
Notice that while there
are 10 clusters in the table, the Cluster IDs do not range from 1
to 10.
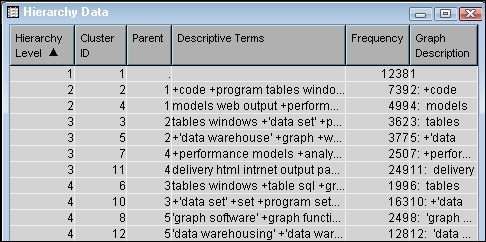
-
Select the
Hierarchy
Data table for more information about the clusters that
appear in the
Clusters table.
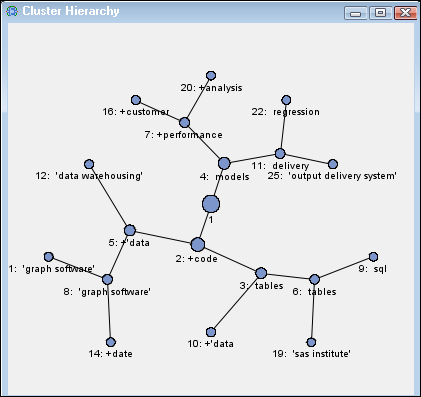
-
Select the
Cluster
Hierarchy table for a hierarchical graphical representation
of the clusters.
-
Close the
Results window.