Using the Text Rule Builder Node
This example uses the
SAMPSIO.NEWS data set to show you how to predict a categorical target
variable with the Text Rule Builder node.
The results will also show that the model is highly interpretable
and useful for explanatory and summary purposes as well. This example
assumes that SAS Enterprise Miner is running, and a that diagram workspace
has been opened in a project. For information about creating a project
and a diagram, see Setting Up Your Project.
The SAMPSIO.NEWS data
set consists of 600 brief news articles. Most of the news articles
fall into one of these categories: computer graphics, hockey, and
medical issues.
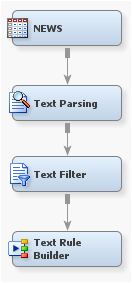
To use the Text
Rule Builder node to predict the categorical target variable, newsgroup,
in the SAMPSIO.NEWS data set:
-
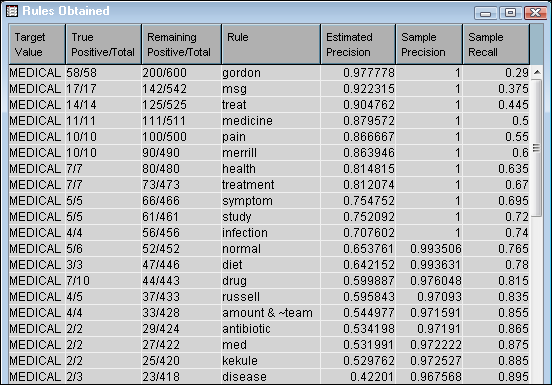
The words in the Rule column have the corresponding estimated precision at implying the target, newsgroup.In the second column above, the True Positive (the first number) is the number of documents that were correctly assigned to the rule. The Total (the second number) is the total positive.In the third column above, the Remaining Positive (the first number) is the total number of remaining documents in the category. The Total (the second number) is the total number of documents remaining.In the above example, in the first row, 200 documents have been assigned to the MEDICAL newsgroup, and 600 total documents exist in the data set. Fifty-eight of the documents were assigned to the rule “gordon” (58 were correctly assigned). This means that if a document contains the word “gordon,” and you assign all those documents to the MEDICAL newsgroup, 58 out of 58 will be assigned correctly. In the next row, there are 200 – 58 = 142 MEDICAL newsgroup documents left that can be evaluated for rule assignment, out of a total of 600 – 58 = 542 documents. In this second row, 17 documents are correctly assigned to the rule “msg.” This means that if a document contains the term “msg,” and you assign all those documents to the MEDICAL newsgroup, 17 out of 17 will be assigned correctly.Most of the rules are single term rules because the NEWS data set is limited in size. However, there is one multiple term rule above. In the 16th row, the rule “amount & ~team” means that if a document contains the word “amount” and does not contain the word “team,” then 4 of the remaining documents will be correctly assigned to the MEDICAL newsgroup.
-
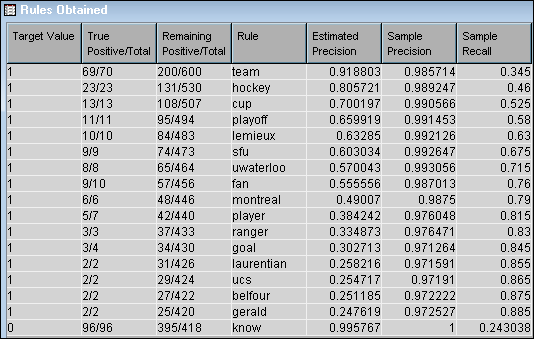
Select the Rules Obtained table to see information about the rules that predicted the target — the HOCKEY newsgroup.The words in the Rule column have the corresponding estimated precision at implying the hockey target.In the above example, in the first row, 200 documents have been assigned to the HOCKEY newsgroup, and 600 total documents exist in the data set. The target value is
1, instead of “HOCKEY,” because you set the hockey variable to be the target instead of the newsgroup variable. 70 of the documents were assigned to the rule “team” (69 were correctly assigned). This means that if a document contains the word “team,” and you assign all those documents to the HOCKEY newsgroup, 69 out of 70 will be assigned correctly. In the next row, there are 200 – 69 = 131 HOCKEY documents left that can be evaluated for rule assignment, out of a total of 600 – 70 = 530 documents. In this second row, 23 documents are correctly assigned to the rule “hockey.” This means that if a document contains the word “hockey,” and you assign all those documents to the HOCKEY newsgroup, 23 out of 23 will be assigned correctly.