About the Scenario in This Book
The first seven chapters
describe an extended example that is intended to familiarize you with
SAS Text Miner. Each topic builds on the previous topic, so you must
work through these chapters in sequence. Several key components of
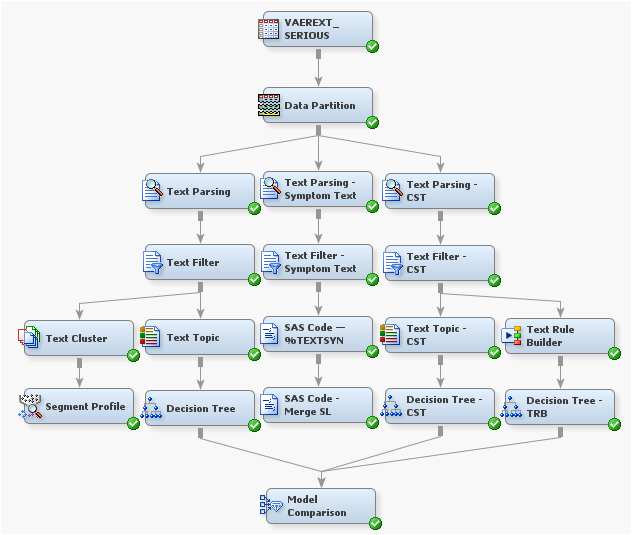
the SAS Text Miner process flow diagram are covered. In this step-by-step
example, you learn to do basic tasks in SAS Text Miner, such as creating
a project and building a process flow diagram. In your diagram, you
perform tasks such as accessing data, preparing the data, building
multiple predictive models using text variables, and comparing the
models. The extended example in this book is designed to be used in
conjunction with SAS Text Miner software. The remaining chapters focus
on each of the SAS Text Miner nodes, and provide additional information
that you might find useful for your text mining analysis.
The Vaccine Adverse Event Reporting System (VAERS) data
is publicly available from the U.S. Department of Health and Human
Services (HHS). Anyone can download this data in comma-separated value
(CSV) format from http://vaers.hhs.gov. There
are separate CSV files for every year since the U.S. started collecting
the data in 1990. This data is collected from myriad sources, but
most reports come from vaccine manufacturers and health care providers.
Providers are required to report any contraindicated events for a
vaccine or any very serious complications. In the context of a vaccine,
a contraindication event would be a condition or a factor that increases
the risk of using the vaccine.
Note: See Prerequisites for This Scenario
for information about where to download the Getting Started
Examples zip file.
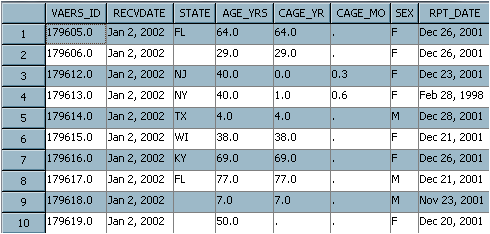
The following figure
shows the first 8 columns in the first 10 rows in a table of VAERS
data. Included is a unique identifier, the state of residence, and
the recipient's age. Additional columns (not in the following figure)
include an unstructured text string SYMPTOM_TEXT that contains the
reported problem, specific symptoms, and a symptom counter.
As you go through this
example, imagine you are a researcher trying to discover what information
is contained within this data set. You also want to know how you can
use it to better understand the adverse reactions that children and
adults are experiencing from their vaccination shots. These adverse
reactions might be caused by one or more of the vaccinations that
they are given, or they might be induced by an improper procedure
from the administering lab (for example, a non-sanitized needle).
Some of them will be totally unrelated. For example, perhaps someone
happened to get a cold just after receiving a flu vaccine and reported
it. You might want to investigate serious reactions that required
a hospital stay or caused a lifetime disability or death.