About the Scenario in This Book
This book
describes an extended example that is intended to familiarize you
with the many features of SAS Text Miner. Each topic in this book
builds on the previous topic, so you must work through the chapters
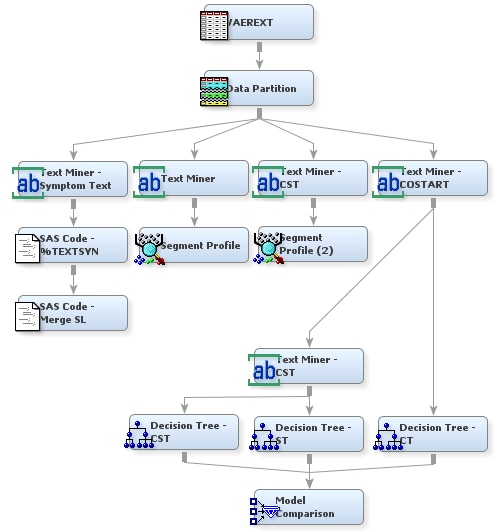
in sequence. Several key components of the SAS Text Miner process
flow diagram are covered. In this step-by-step example, you learn
to do basic tasks in SAS Text Miner, such as how to create a project
and build a process flow diagram. In your diagram, you perform tasks
such as accessing data, preparing the data, building multiple predictive
models using text variables, and comparing the models. The extended
example in this book is designed to be used in conjunction with SAS
Text Miner software.
The Vaccine Adverse Event Reporting System (VAERS) data
is publicly available from the U.S. Department of Health and Human
Services (HHS). Anyone can download this data in comma-separated value
(CSV) format from http://vaers.hhs.gov. There
are separate CSV files for every year since the U.S. started collecting
the data in 1990. This data is collected from anybody, but most reports
come from vaccine manufacturers (42%) and health care providers (30%).
Providers are required to report any contraindicated events for a
vaccine or any very serious complications. In the context of a vaccine,
a contraindication event would be a condition or a factor that increases
the risk of using the vaccine. Please see the “Guide to Interpreting
Case Report Information Obtained from the Vaccine Adverse Event Reporting
System (VAERS)” available from HHS (
http://vaers.hhs.gov/info.htm).
Note: See Prerequisites for This Scenario
for information about where to download the Getting Started
Examples zip file.
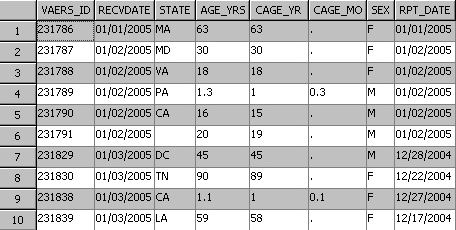
The following
figure shows the first 8 columns in the first 10 rows in the table
of VAERS data for 2005. Included is a unique identifier, the state
of residence, and the recipient's age. Additional columns (not in
the following figure) include an unstructured text string SYMPTOM_TEXT
that contains the reported problem, specific symptoms, and a symptom
counter.
In analyzing adverse reactions to medications,
both in clinical trials and in post-release monitoring of reactions,
keyword or word-spotting techniques combined with a thesaurus are
most often used to characterize the symptoms. The Coding Symbols for
Thesaurus of Adverse Reaction Terms (COSTART) has traditionally been
the categorization technique of choice, but it has been largely replaced
by the Medical Dictionary for Regulatory Affairs (MedDRA). COSTART
is a term developed by the U.S. Food and Drug Administration (FDA)
for the coding, filing, and retrieving of post-marketing adverse reports.
It provides a keyword-spotting technique that deals with the variations
in terms used by those who submit adverse event reports to the FDA.
In the
case of vaccinations, the COSTART system has been used. The FDA has
used a program to extract COSTART categories from the SYMPTOM_TEXT
column. Here are some of the variables used by the program:
If you
open the VAERS data for 2005 you can see that VAERS_ID
231844 has SYMPTOM_TEXT of 101 fever,
stiff neck, cold — the program has automatically
extracted the COSTART terms that appear in column SYM01 to column
SYM20 in the data file.
The VAERS
table contains other columns, including a variety of flags that indicate
the seriousness of the event (life-threatening illness, emergency
room or doctor visit, hospitalized, disability, recovered), the number
of days after the vaccine that the event occurred, how many different
vaccinations were given, and a list of codes (VAX1-VAX8) for each
of the shots given. There are also columns indicating where the shots
were given, who funded them, what medications the patient was taking,
and so on.
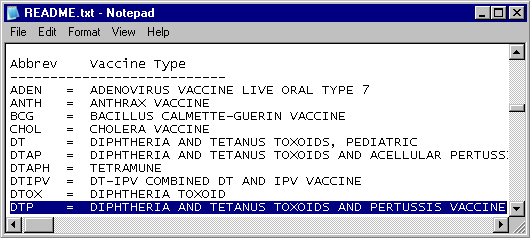
The README
file taken from the VAERS Web site decodes the vaccine abbreviations.
Note that some vaccinations contain multiple vaccines (for example,
DTP contains diphtheria, tetanus, and pertussis). Here is a portion
of the README file:
As you
go through this example, imagine you are a researcher
trying to discover what information is contained within this data
set and how you can use it to better understand the adverse reactions
that children and adults are experiencing from their vaccination shots.
These adverse reactions might be caused by one or more of the vaccinations
they are given, or they might be induced by an improper procedure
from the administering lab (for example, a non-sanitized needle).
Some of them will be totally unrelated. For example, perhaps someone
happened to get a cold just after receiving a flu vaccine and reported
it. You might want to investigate serious reactions that required
a hospital stay or caused a lifetime disability or death, and find
answers to the following questions: