ODS Graphics Template Modification
Modifying Tick Marks and Grid Lines
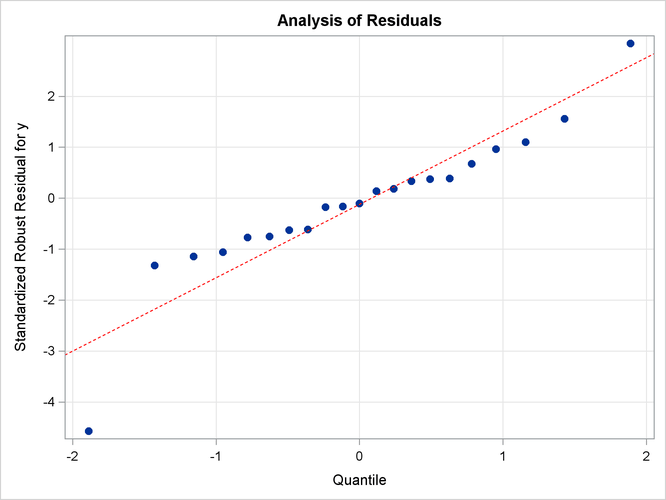
This section illustrates how to modify axis tick marks and control grid lines. For example, you can specify the following statement to request tick marks ranging from –4 to 2 in the Y-axis:
layout Overlay / yaxisopts=(linearopts=(tickvaluelist=(-4 -3 -2 -1 0 1 2)));
The LINEAROPTS= option is used for standard linearly scaled axes (as opposed to log-scaled axes). You use the TICKVALUELIST= to specify the tick marks.
You can control the grid lines by using the GRIDDISPLAY= suboption in the YAXISOPTS= option. Typically, you specify either
GRIDDISPLAY=AUTO_OFF (grid lines are not displayed unless the GraphGridLines element in the current style contains DisplayOpts="ON") or GRIDDISPLAY=AUTO_ON (grid lines are displayed unless the GraphGridLines element in the current style contains DisplayOpts="OFF"). Here, the template is modified by specifying GRIDDISPLAY=AUTO_ON for both axes. The following statements produce Output 22.1.4:
proc template;
   define statgraph Stat.Robustreg.Graphics.QQPlot;
      notes "Q-Q Plot for Standardized Robust Residuals";
      dynamic _DEPLABEL Residual _byline_ _bytitle_ _byfootnote_;
      BeginGraph;
         entrytitle "Analysis of Residuals";
         Layout Overlay /
            yaxisopts=(gridDisplay=Auto_On
                       linearopts=(tickvaluelist=(-4 -3 -2 -1 0 1 2))
                       label=("Standardized Robust Residual for " _DEPLABEL))
            xaxisopts=(gridDisplay=Auto_On label="Quantile");
            SCATTERPLOT y=eval (SORT(DROPMISSING(RESIDUAL))) x=eval (
               PROBIT((NUMERATE(SORT(DROPMISSING(RESIDUAL))) -0.375)/(0.25 +
               N(RESIDUAL)))) / primary=true
               markerattrs=GraphDataDefault(symbol=CircleFilled)
               rolename=(q=eval(
               PROBIT((NUMERATE(SORT(DROPMISSING(RESIDUAL))) -0.375)/(0.25 +
               N(RESIDUAL)))) s=eval (SORT(DROPMISSING(RESIDUAL))))
               tip=(q s) tiplabel=(q= "Quantile" s="Residual");
            lineparm slope=eval (STDDEV(RESIDUAL)) Y=eval (MEAN(RESIDUAL)) X=0 /
               clip=false lineattrs=GraphReference(color=red pattern=dash)
               extend=true;
         EndLayout;
         if (_BYTITLE_)
            entrytitle _BYLINE_ / textattrs=GRAPHVALUETEXT;
         else
            if (_BYFOOTNOTE_)
               entryfootnote halign=left _BYLINE_;
            endif;
         endif;
      EndGraph;
   end;
run;

ods graphics on;

proc robustreg data=stack plots=qqplot;
   ods select QQPlot;
   model y = x1 x2 x3;
run;
Output 22.1.4: Q-Q Plot with Modified Y-Axis Tick Marks and Grids
You can restore the default template by running the following step:
proc template;
   delete Stat.Robustreg.Graphics.QQPlot / store=sasuser.templat;
run;
For more information about grid lines, see the section Modifying the Style to Show Grid Lines.