Statistical Graphics Using ODS
Example 21.5 Customizing the Style for Box Plots
This example demonstrates how to modify the style for box plots. This example is taken from Example 21.1. The following step creates the data set:
data pr;
   input Person Gender $ y1 y2 y3 y4 @@;
   y=y1; Age=8;  output;
   y=y2; Age=10; output;
   y=y3; Age=12; output;
   y=y4; Age=14; output;
   drop y1-y4;
   datalines;
 1  F  21.0  20.0  21.5  23.0      2  F  21.0  21.5  24.0  25.5
 3  F  20.5  24.0  24.5  26.0      4  F  23.5  24.5  25.0  26.5

   ... more lines ...

;
The following step displays the HTMLBLUE style and its parent styles, STATISTICAL and DEFAULT:
proc template;
   source Styles.HTMLBlue / expand;
run;
If you search for "box", you find the style element that controls some aspects of the box plot:
   class GraphBox /
      capstyle = "serif"
      connect = "mean"
      displayopts = "fill caps median mean outliers";
You can learn more about the GraphBox style element and its attributes in the section on the BOXPLOT statement in the
SAS Graph Template Language: Reference and in the section "ODS Style Elements" in the
SAS Output Delivery System: User's Guide.
The following statements create two new styles by modifying attributes of the GraphBox style element. The first style is a sparse style; the box is outlined (not filled), and the median is shown, but not the
mean. In contrast, the second style produces a filled box, with caps on the whiskers that shows the mean, median, and outliers.
In addition, the box is notched.
The following statements create the two styles:
proc template;
   define style BoxStyleSparse;
      parent=styles.HTMLBlue;
      style GraphBox / capstyle = "line" displayopts = "median";
   end;
   define style BoxStyleRich;
      parent=styles.HTMLBlue;
      style GraphBox / capstyle = "bracket"
            displayopts = "fill caps median mean outliers notches";
   end;
run;
The following steps run PROC MIXED and create box plots that use the two styles:
ods graphics on;
ods listing style=boxstylesparse;

proc mixed data=pr method=ml plots=boxplot;
   ods select 'Conditional Residuals by Gender';
   class Person Gender;
   model y = Gender Age Gender*Age;
   random intercept Age / type=un subject=Person;
run;

ods listing style=boxstylerich;

proc mixed data=pr method=ml plots=boxplot;
   ods select 'Conditional Residuals by Gender';
   class Person Gender;
   model y = Gender Age Gender*Age;
   random intercept Age / type=un subject=Person;
run;
The results from using the sparse style are displayed in Output 21.5.1, and the results from using the richer style are displayed in Output 21.5.2. See Output 21.1.1 in Example 21.1 for the results of using the HTMLBLUE style.
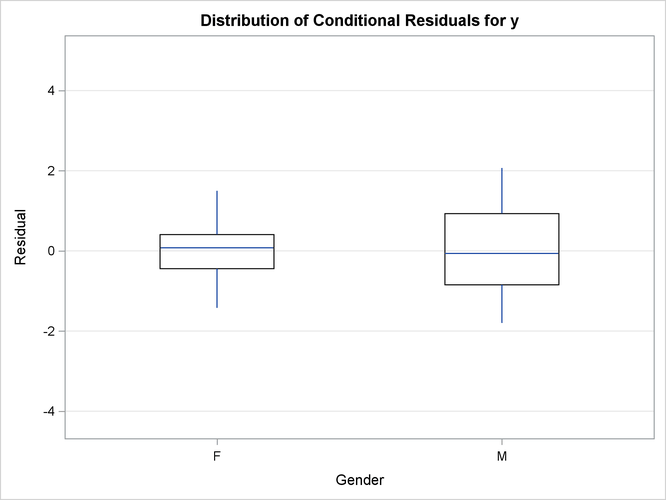
Output 21.5.1: Box Plot with the Sparse Style
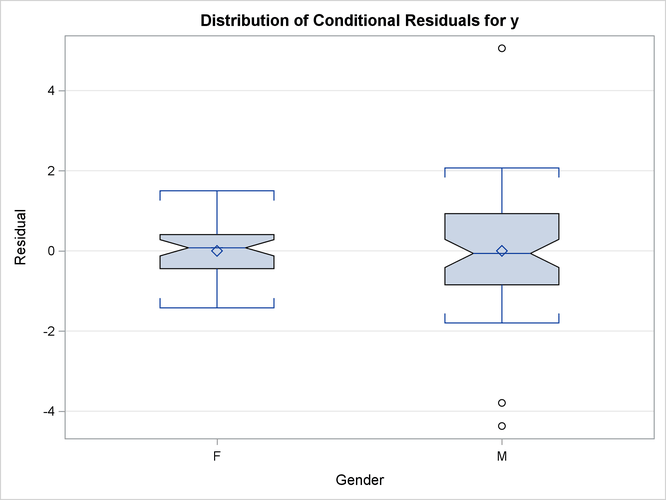
Output 21.5.2: Box Plot with the Richer Style