Statistical Graphics Using ODS
Default Plots for Simple Linear Regression with PROC REG
This example is based on the section Getting Started: REG Procedure in Chapter 97: The REG Procedure. The Class data set that this example uses is available in the Sashelp library. The following statements use PROC REG to fit a simple linear regression model in which Weight is the response variable and Height is the independent variable:
ods graphics on;

proc reg data=sashelp.class;
   model Weight = Height;
run; quit;
The ODS GRAPHICS ON statement requests ODS Graphics in addition to the usual tabular output. The statement ODS GRAPHICS OFF is not used here, but it can be specified to disable ODS Graphics.
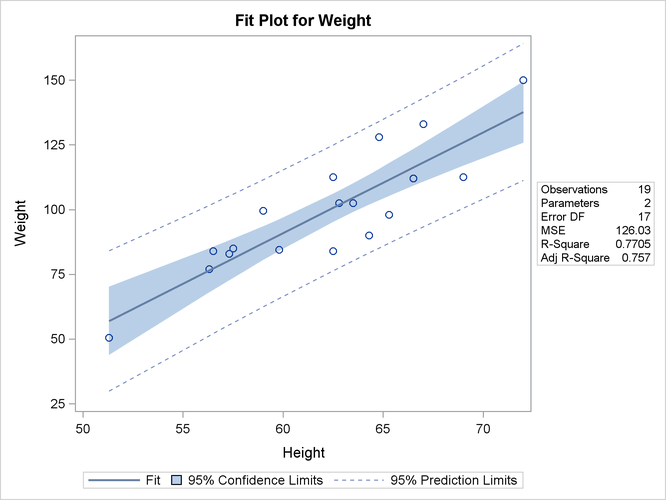
The graphical output consists of a fit diagnostics panel, a residual plot, and a fit plot. These plots are integrated with the tabular output and are shown in Figure 21.1, Figure 21.2, and Figure 21.3, respectively.
The results are displayed in the HTMLBLUE style. ODS styles control the colors and general appearance of all graphs and tables, and the SAS System provides several styles that are recommended for use with statistical graphics. The default style that you see when you run SAS depends on the ODS destination, system options, and SAS registry settings. For more information about styles, see the section ODS Styles and the section ODS Styles.
Figure 21.1: Fit Diagnostics Panel
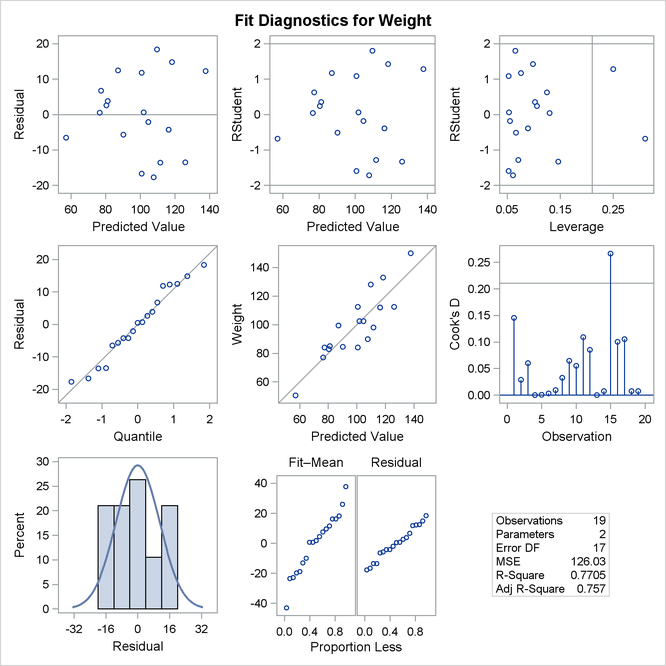
Figure 21.2: Residual Plot
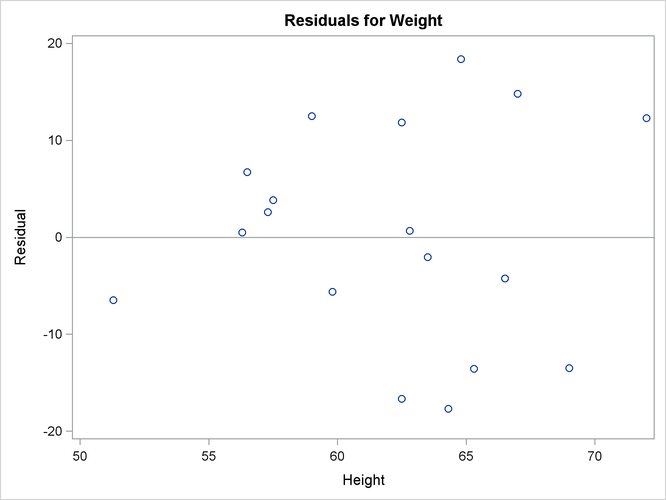
Figure 21.3: Fit Plot