Customizing the Kaplan-Meier Survival Plot
Modifying the Axis
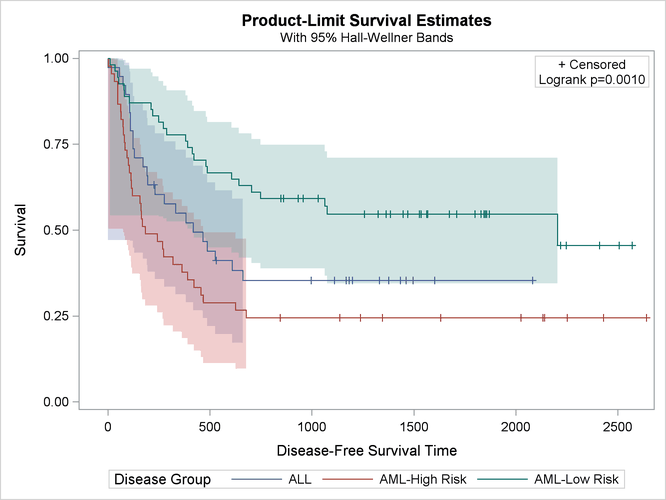
The following statements modify the default tick value list for the Y axis from the default increment of 0.2 to have an increment of 0.25 and also change the Y-axis label to 'Survival':
/*-- Original Macro Variable Definitions ----------------------------------
%let yOptions   = label="Survival Probability" shortlabel="Survival"
                  linearopts=(viewmin=0 viewmax=1
                              tickvaluelist=(0 .2 .4 .6 .8 1.0));
-------------------------------------------------------------------------*/

%ProvideSurvivalMacros

%let yOptions = label="Survival"
                linearopts=(viewmin=0 viewmax=1
                            tickvaluelist=(0 .25 .5 .75 1));

%CompileSurvivalTemplates

proc lifetest data=sashelp.BMT plots=survival(cb=hw test);
   time T * Status(0);
   strata Group;
run;
The results are displayed in Figure 23.18.
Figure 23.18: Y-Axis Modification
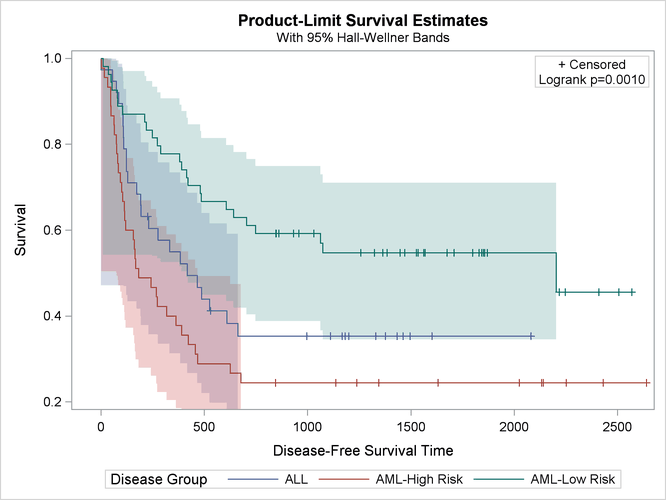
The following statements modify the Y axis so that tick marks start at 0.2:
%ProvideSurvivalMacros

%let yOptions = label="Survival"
                linearopts=(viewmin=0.2 viewmax=1
                            tickvaluelist=(0 .2 .4 .6 .8 1.0));

%CompileSurvivalTemplates

proc lifetest data=sashelp.BMT plots=survival(cb=hw test);
   time T * Status(0);
   strata Group;
run;
You only need to change the value of the VIEWMIN= option, in this case from 0 to 0.2. You do not need to modify the tick value list. The VIEWMIN= option (not the tick value list) controls the smallest value shown on the axis. The results are displayed in Figure 23.19.
Figure 23.19: Y Axis, First Tick Change