Customizing the Kaplan-Meier Survival Plot
Enabling ODS Graphics and the Default Kaplan-Meier Plot
You can use the following statements to enable ODS Graphics and run PROC LIFETEST:
ods graphics on;

proc lifetest data=sashelp.BMT;
   time T * Status(0);
   strata Group;
run;
ODS Graphics is enabled for this step and all subsequent steps until it is disabled. ODS Graphics remains enabled throughout the examples in this chapter.
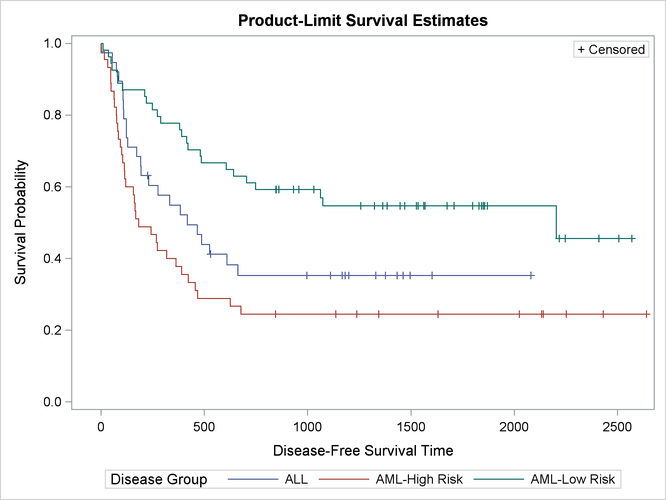
You specify in the TIME statement that the disease-free survival time is recorded in the variable T. You further specify that the variable Status indicates censoring and 0 indicates a censored time. Separate survivor functions are displayed for each group in the Group variable, which you specify in the STRATA statement.
The plot in Figure 23.1 consists of three step functions, one for each of the three groups of patients. The plot shows that patients in the AML–Low Risk group have longer disease-free survival than patients in the ALL and AML–High Risk groups.
Figure 23.1: Default Kaplan-Meier Plot
The following step, which explicitly specifies the default PLOTS=SURVIVAL option, is equivalent to the preceding step:
proc lifetest data=sashelp.BMT plots=survival;
   time T * Status(0);
   strata Group;
run;
The PLOTS= option enables you to control the graphs that a procedure produces. You can use it to request nondefault graphs and specify options for some graphs. You can specify graph names (PLOTS=SURVIVAL), graph options (PLOTS=SURVIVAL(ATRISK OUTSIDE)), and suboptions (PLOTS=SURVIVAL(ATRISK OUTSIDE(0.15))). The PLOTS= option is described in the section PROC LIFETEST Statement in Chapter 70: The LIFETEST Procedure.