ODS Graphics Template Modification
The following steps run PROC TRANSREG to find a cubic fit function and display the equation in a plot generated by PROC SGPLOT:
proc transreg data=sashelp.class ss2;
ods output fitstatistics=fs coef=c;
model identity(weight) = pspline(height);
run;
data _null_;
set fs;
if _n_ = 1 then call symputx('R2' , put(value2, 4.2) , 'G');
if _n_ = 2 then call symputx('mean', put(value1, best6.), 'G');
run;
data _null_;
set c end=eof;
length s $ 200 c $ 1;
retain s ' ';
if _n_ = 1 then
s = scan(dependent, 2, '()') || ' = ' || /* dependent = */
put(coefficient, best5. -L); /* intercept */
else if abs(coefficient) > 1e-8 then do; /* skip zero coefficients */
s = trim(s) || ' ' || /* string so far */
scan('+ -', 1 + (coefficient < 0), ' ') /* + (add) or - (subtract) */
|| ' ' ||
trim(put(abs(coefficient), best5. -L )) /* abs(coefficient) */
|| ' ' || scan(variable, 2, '._'); /* variable name */
c = scan(variable, 2, '_'); /* grab power */
if c ne '1' then /* skip power for linear */
s = trim(s) || /* string so far */
"(*ESC*){sup '" || c || "'}"; /* add superscript */
end; /* e for error added next */
if eof then call symputx('formula', trim(s) || ' + e', 'G');
run;
proc sgplot data=sashelp.class;
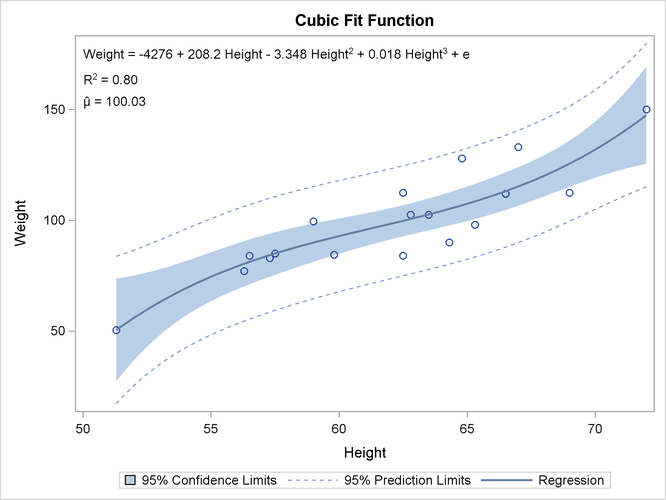
title 'Cubic Fit Function';
inset "&formula"
"R(*ESC*){sup '2'} = &r2"
"(*ESC*){unicode mu}(*ESC*){unicode hat} = &mean" / position=topleft;
reg y=weight x=height / degree=3 cli clm;
run;
These steps create Output 22.2.5.
The PROC TRANSREG MODEL statement fits a model with an untransformed dependent variable and a cubic polynomial function of
the independent variable. By default, PSPLINE fits a cubic polynomial spline with no knots, which is simply a cubic polynomial.
The fit statistics and parameter estimates are output to data sets, and their values are stored in macro variables. There
are three independent variables plus the intercept. Variable names and exponents are extracted from the TRANSREG parameter
names of Pspline.Height_1, Pspline.Height_2, and Pspline.Height_3 by using the SCAN function. Exponents are added by using the specifications "(*ESC*)![]()
sup ’2’![]()
" and "(*ESC*)![]()
sup ’3’![]()
", which are explained in more detail with the INSET statement.
PROC SGPLOT with an INSET statement makes the plot. Each separate string is displayed in a separate line. The first string
is the formula, which is generated in the second DATA step. The next string is the R square: it consists of an 'R', an escaped
superscript 2, and the value of R square (which is stored in a macro variable). The string for the mean consists of two Unicode
specifications, one for the Greek letter ![]() , and one to put a hat over it. These special character specifications appear in quotes and are escaped with
, and one to put a hat over it. These special character specifications appear in quotes and are escaped with (*ESC*) so that they are processed as special characters rather than as literal text. Typically, you must escape special characters
in quotes, and not escape them when they are not in quotes. See section Simple Linear Regression for more information about Unicode characters. See the section Unicode and Special Characters for a list of a few of the more commonly used Unicode characters.