Customizing the Kaplan-Meier Survival Plot
The following steps add an ENTRYFOOTNOTE statement to the %StmtsBeginGraph macro and suppress the second title:
%ProvideSurvivalMacros

%let ntitles = 1;
%macro StmtsBeginGraph;
   entryfootnote halign=left "Acme Company %sysfunc(date(),worddate.)" /
                 textattrs=GraphDataText;
%mend;

%CompileSurvivalTemplates

proc lifetest data=sashelp.BMT
              plots=survival(cb=hw test);
   time T * Status(0);
   strata Group;
run;
The results are displayed in Figure 23.28.
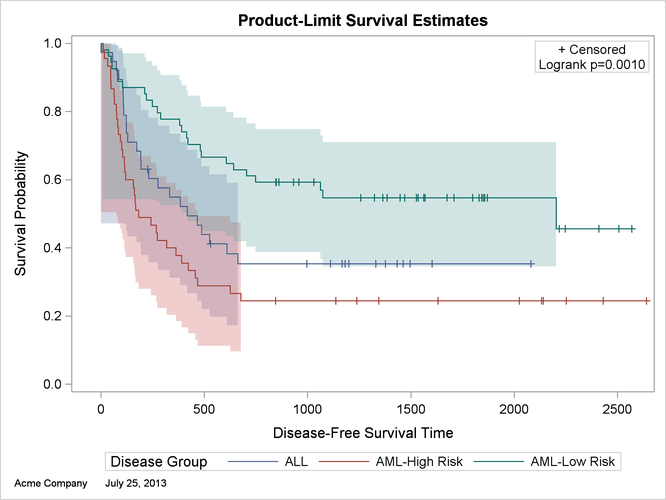
By default, the nTitles macro variable is 2, and all titles are displayed. Setting nTitles to 1 suppresses the second title. You can add titles or footnotes to the plot by adding them to the %StmtsBeginGraph macro.
This example adds a footnote that consists of a company name followed by the current date, formatted by using the WORDDATE
format. The GraphDataText style element is used; it has a smaller font than the default style element, GraphFootnoteText.