Customizing the Kaplan-Meier Survival Plot
You can use the PLOTS=SURVIVAL(NOCENSOR) option to suppress the display of censored observations as follows:
proc lifetest data=sashelp.BMT
plots=survival(nocensor test atrisk(maxlen=13));
time T * Status(0);
strata Group;
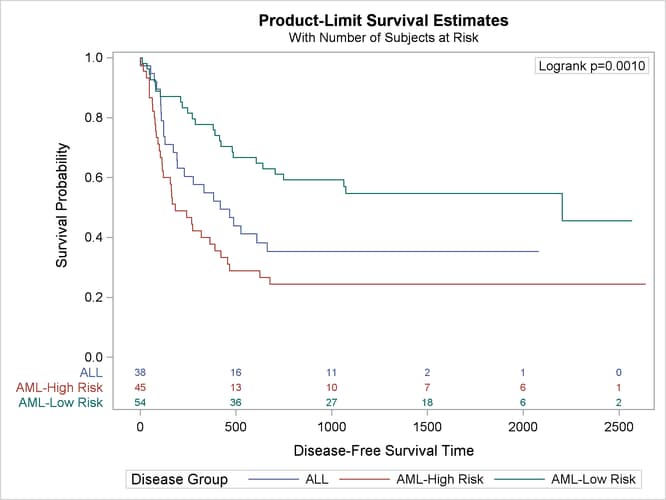
run;
The results are displayed in Figure 23.15.