Customizing the Kaplan-Meier Survival Plot
You can add the patients-at-risk table to the Kaplan-Meier plot as follows:
proc lifetest data=sashelp.BMT plots=survival(cb=hw test atrisk);
   time T * Status(0);
   strata Group;
run;
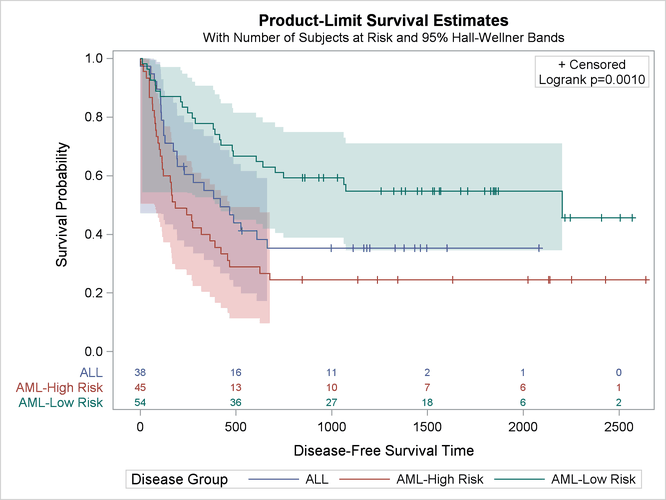
The results are displayed in Figure 23.7. By default, the at-risk table is displayed inside the body of the plot. This table shows the number of patients who are at risk for each group for each of the different times. For these data, the default survival times at which at-risk values are displayed are 0 to 2500 by 500. You will see how to specify other values in subsequent examples.
The group labels for the at-risk table are group numbers, and these numbers appear in the legend. Numbers are used rather than the actual labels because the length of the longest label (13) is greater than the default that is set by the maximum label length option (MAXLEN=12). You can display labels rather than the group numbers by specifying a MAXLEN= value equal to the maximum group label length as follows:
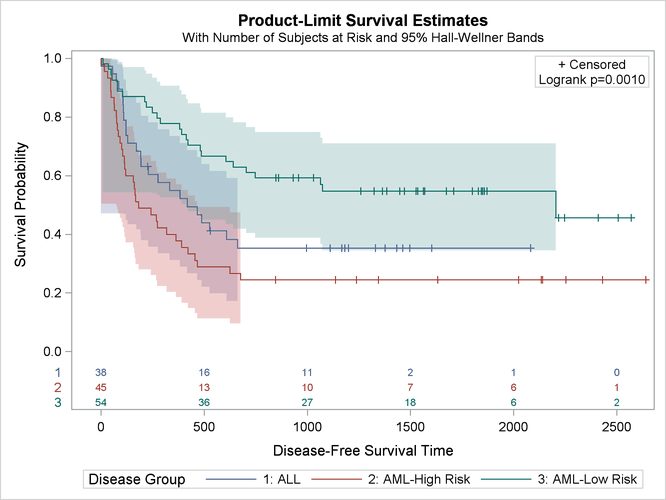
proc lifetest data=sashelp.BMT plots=survival(cb=hw test atrisk(maxlen=13));
   time T * Status(0);
   strata Group;
run;
The results are displayed in Figure 23.8. The legend entries and the order of the rows in the at-risk table correspond to the sort order of the values of the Group variable.