Introduction to Power and Sample Size Analysis
If you include a PLOT statement, the GLMPOWER and POWER procedures produce standard power curves, which represent any multivalued input parameters with varying line styles, symbols, colors, and/or panels. The Power and Sample Size application also has an option to produce power curves. If ODS Graphics is enabled, then graphs are created using ODS Graphics; otherwise, traditional graphs are produced.
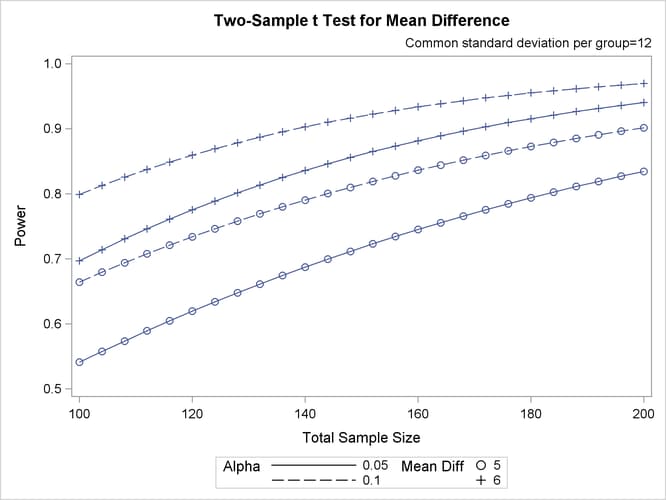
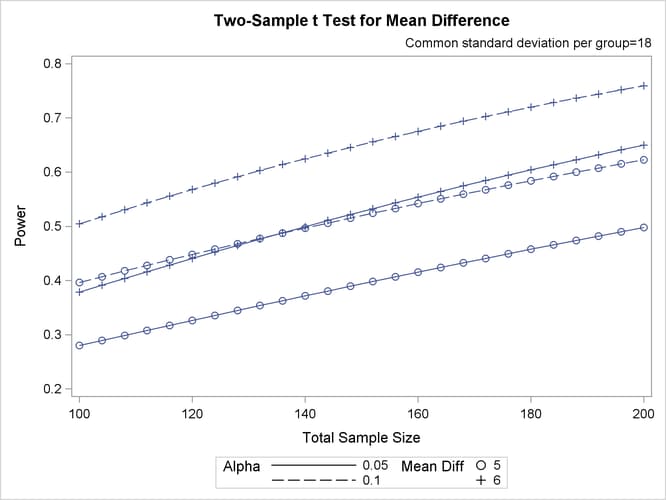
To display default power curves for the preceding PROC POWER call, add the PLOT statement with no arguments as follows:
ods graphics on;

proc power plotonly;
   twosamplemeans test=diff
      meandiff = 5 6
      stddev = 12 18
      alpha = 0.05 0.1
      ntotal = 100 200
      power = .;
   plot;
run;

ods graphics off;
The ODS GRAPHICS ON statement enables ODS Graphics.
Figure 18.2 shows the results. Note that the line style varies by the significance level ![]() , the symbol varies by the mean difference, and the panel varies by standard deviation.
, the symbol varies by the mean difference, and the panel varies by standard deviation.