Introduction to Structural Equation Modeling with Latent Variables
This section shows how you can produce high-quality graphical output for path diagrams from the CALIS procedure. Using the spleen data and the model that is represented by the path diagram in Figure 17.13 or Figure 17.14, the following statements produce the default path diagram in the output:
ods graphics on;

proc calis data=spleen plots=pathdiagram;
   path
      sqrtrose <=== factrose   = 1.0,
      sqrtnucl <=== factnucl   = 1.0,
      factrose <=== factnucl   ;
   pvar
      sqrtrose = 0.25,      /* error variance for sqrtrose */
      sqrtnucl = 0.25,      /* error variance for sqrtnucl */
      factrose,             /* disturbance/error variance for factrose */
      factnucl;             /* variance of factnucl */
run;
ods graphics off;
The ODS GRAPHICS ON statement enables the ODS Graphics, and the PLOTS=PATHDIAGRAM requests that the default path diagram of the unstandardized solution, which is shown in Figure 17.16, be output.
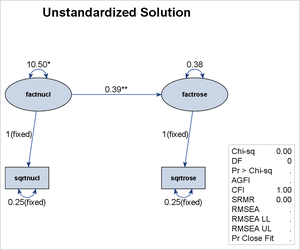
The output path diagram in Figure 17.16 uses a similar representation scheme as the simplified path diagram that is shown in Figure 17.14, except that the output path diagram in Figure 17.16 is for the unstandardized solution rather than the initial specification. The output path diagram in Figure 17.16 shows the final parameter estimates and indicates their statistical significance. Estimates that are significant at the 0.05
![]() -level are flagged with a single asterisk, and estimates that are significant at the 0.01
-level are flagged with a single asterisk, and estimates that are significant at the 0.01 ![]() -level are flagged with two asterisks. Hence, the path diagram shows that
-level are flagged with two asterisks. Hence, the path diagram shows that factnucl has a significant effect on factrose. In addition to showing the free parameter estimates, the path diagram shows the fixed parameter values and marks them as
"fixed." The path diagram also includes a fit summary table to show the model fit statistics. However, because the model in
Figure 17.16 is a saturated model, interpretations of the fit statistics are not meaningful.
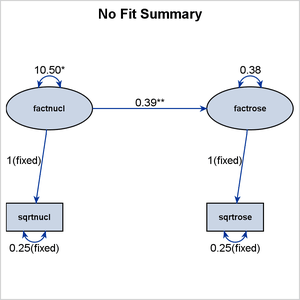
PROC CALIS provides a wide range of options in the PATHDIAGRAM statement that you can use to customize the output path diagrams. This section illustrates some simple customization options. For example, because the fit summary statistics are not meaningful in the preceding model for the Spleen data, you can omit the fit summary table in the path diagram output by adding the following PATHDIAGRAM statement to the preceding CALIS run:
pathdiagram nofittable title='No Fit Summary';
The NOFITTABLE option suppresses the printing of the fit summary table, and the TITLE= option specifies the customized title. The resulting path diagram is shown in Figure 17.17.
You can also change the styles of the path diagrams by using options in the PATHDIAGRAM statement. For example, to produce a path diagram for the initial specification that has the same style as the one shown in Figure 17.13, you can use the following PATHDIAGRAM statement:
proc calis data=spleen;
   path
      sqrtrose <=== factrose   = 1.0,
      sqrtnucl <=== factnucl   = 1.0,
      factrose <=== factnucl   = beta;
   pvar
      sqrtrose = 0.25,       /* error variance for sqrtrose */
      sqrtnucl = 0.25,       /* error variance for sqrtnucl */
      factrose = v_disturb,  /* disturbance/error variance for factrose */
      factnucl = v_factnucl; /* variance of factnucl */
   pathdiagram diagram=initial useerr;
run;
In the PATHDIAGRAM statement, the DIAGRAM=INITIAL option requests the path diagram for the initial model specification, and the USEERR option requests that the error variables be included in the path diagram. The resulting path diagram is shown in Figure 17.18.
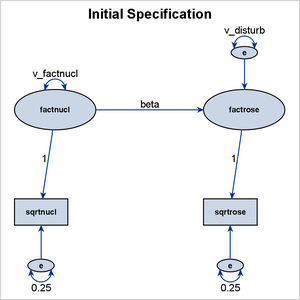
All error terms in Figure 17.18 are labeled by "e." Except for the orientation and the omission of the fixed unit constants in the paths from the error variables, this path diagram matches the style that is used in Figure 17.13.
For more information about path diagram customizations, see the PATHDIAGRAM statement and the section Path Diagrams: Layout Algorithms, Default Settings, and Customization in Chapter 29: The CALIS Procedure. For introductory examples of creating and editing path diagrams from the CALIS procedure, see Yung (2014).