The Power and Sample Size Application
The SAS Power and Sample Size application (PSS) is a desktop application that provides easy access to power analysis and sample size determination techniques. The application is intended for students and researchers as well as experienced SAS users and statisticians.
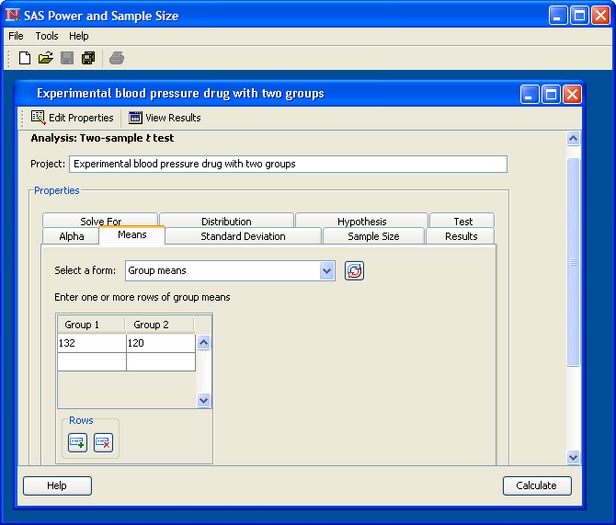
Figure 78.1 shows the graphical user interface. PSS relies on the SAS/STAT procedures POWER and GLMPOWER for its computations.
This section describes the statistical tasks that are available with the application as well as its principal features.
PSS provides power and sample size computations for a variety of statistical analyses. Included are t tests for means; equivalence tests and confidence intervals for means and proportions; exact binomial, chi-square, Fisher’s exact, and McNemar tests for proportions; correlation and regression (multiple and logistic); one-way analysis of variance; linear models; tests of distribution; and rank tests for comparing survival curves.
Table 78.1 lists the analyses that are available.
Table 78.1: Available Analyses
|
Category |
Analysis |
|---|---|
|
Means |
One-sample t test |
|
Paired t test |
|
|
Two-sample t test |
|
|
Confidence intervals |
One proportion |
|
One-sample means |
|
|
Paired means |
|
|
Two-sample means |
|
|
Equivalence tests |
One proportion |
|
One-sample means |
|
|
Paired means |
|
|
Two-sample means |
|
|
Proportions |
One proportion |
|
Two correlated proportions |
|
|
Two independent proportions |
|
|
Correlation and regression |
Pearson correlation coefficient |
|
Logistic regression with a binary response |
|
|
Multiple regression |
|
|
Analysis of variance and linear models |
One-way ANOVA |
|
General linear univariate models |
|
|
Survival analysis |
Two-sample survival rank tests |
|
Distribution tests |
Wilcoxon Mann-Whitney test for two distributions |
PSS provides multiple input parameter options, stores the results in a project format, displays power curves, and produces narratives for the results. Narratives are descriptions of the input parameters and include a statement about the computed power or sample size. The SAS log and SAS code are also available.
All analyses offer computation of power or sample size. Some analyses offer computation of sample size per group as well as total sample size.
Where appropriate, several alternate ways of entering values for certain parameters are offered. For example, in the two-sample t test analysis, means can be entered for individual groups or as a difference. The null mean difference can be specified as a default of zero or can be explicitly entered.
Information about existing analyses is stored in a project format. You can access each project to review the results or to edit your input parameters and produce another analysis.