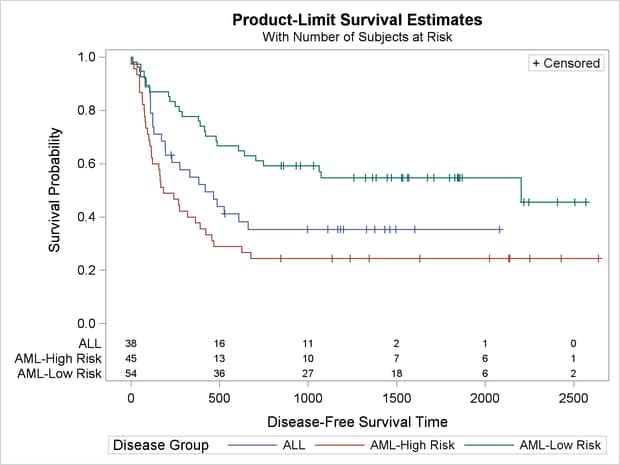
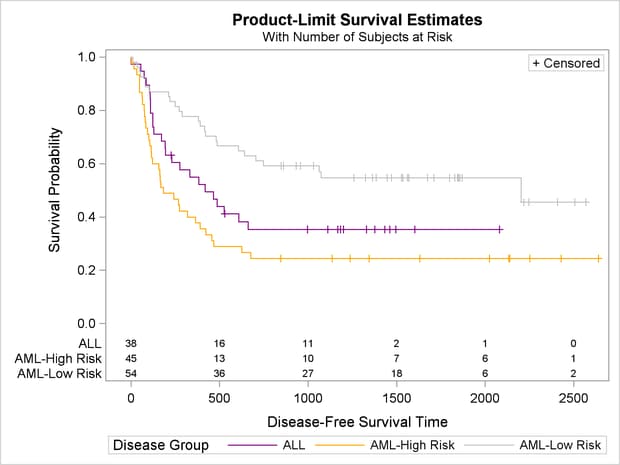
The survival plot for multiple strata has a separate step function for each stratum. The information that goes into making
each stratum appears as a separate group of observations in the data object that is displayed in the graph. The template options
GROUP=STRATUM and INDEX=STRATUMNUM specify the data object columns that provide the information for identifying each stratum.
The GROUP= column provides the stratum name, and the INDEX= column provides a numeric index that identifies each group. There
are no options that explicitly control the colors or other aspects of the appearance of information about each stratum. The
number of groups can be large, and it is not known at the time the template is written how many groups must be accommodated.
Therefore, group information is controlled by ODS styles. The style elements GraphData1, GraphData2, GraphData3, and so on control the appearance of groups. See the section Some Common Style Elements for more information.
You can use the HTMLBLUE style when you want groups to be distinguished only by color. Alternatively, you can easily modify any other style to be an all-color style like HTMLBLUE. For example:
proc template;
   define style styles.Statistical2;
      parent = Statistical;
      style Graph from Graph / attrpriority = "Color";
      end;
run;
You can instead use the SAS autocall macro %ModStyle. See the section Creating an All-Color Style in Chapter 21: Statistical Graphics Using ODS, for more information. The easiest way to use the %ModStyle macro is as follows:
%modstyle(name=StatColor, parent=statistical)

ods listing style=StatColor;

proc lifetest data=sashelp.BMT
   plots=survival(maxlen=13 atrisk=0 to 2500 by 500);
   ods select SurvivalPlot;
   time T * Status(0);
   strata Group;
run;
A new style called STATCOLOR is created that inherits from the STATISTICAL style. The result (since no other options were specified) is an all-color style. All lines have the same solid line style instead of the default, which uses different line styles. The results are displayed in Output 22.3.8.
There are many other changes you can make to styles, and many other ways to use the %ModStyle macro. The following steps illustrate three ways to change the colors. The first uses the %ModStyle macro and an explicit color list to create an all-color style for the first three groups. The second creates an all-color
style by redefining GraphData1 through GraphData3. The third creates a new style by redefining GraphData1 through GraphData3, inheriting from the old style elements, but overriding the colors. Only the last style change is actually used in this example
to make a graph. The following steps create the graph displayed in Output 22.3.9:
%modstyle(name=StatColor, parent=HTMLBlue, colors=purple orange silver)

proc template;
   define style Styles.StatColor;
      parent = Styles.HTMLBlue;
      style GraphData1 / contrastcolor = purple;
      style GraphData2 / contrastcolor = orange;
      style GraphData3 / contrastcolor = silver;
   end;
run;

proc template;
   define style Styles.StatColor;
      parent = Styles.HTMLBlue;
      style GraphData1 from GraphData1 / contrastcolor = purple;
      style GraphData2 from GraphData2 / contrastcolor = orange;
      style GraphData3 from GraphData3 / contrastcolor = silver;
   end;
run;

ods listing style=StatColor;

proc lifetest data=sashelp.BMT
   plots=survival(maxlen=13 atrisk=0 to 2500 by 500);
   ods select SurvivalPlot;
   time T * Status(0);
   strata Group;
run;
Most other examples in this section change the graph template. This example creates a new style template. Since a new template is created instead of modifying an existing template, there is nothing that must be cleaned up in this example. However, you can delete the new style template as follows:
proc template;
   delete Styles.StatColor / store=sasuser.templat;
run;
Alternatively, there is no harm in leaving it around since it has no effect unless you explicitly specify it on a destination statement.

