| Introduction to Analysis of Variance Procedures |
| From Sums of Squares to Linear Hypotheses |
Analysis of variance (ANOVA) is a technique for analyzing data in which one or more response (or dependent or simply Y) variables are measured under various conditions identified by one or more classification variables. The combinations of levels for the classification variables form the cells of the design for the data. This design can be the result of a controlled experiment or the result of an observational study in which you observe factors and factor level combinations in an uncontrolled environment. For example, an experiment might measure weight change (the dependent variable) for men and women who participated in three different weight-loss programs. The six cells of the design are formed by the six combinations of gender (men, women) and program (A, B, C).
In an analysis of variance, the variation in the response is separated into variation attributable to differences between the classification variables and variation attributable to random error. An analysis of variance constructs tests to determine the significance of the classification effects. A typical goal in such an analysis is to compare means of the response variable for various combinations of the classification variables.
The least squares principle is central to computing sums of squares in analysis of variance models. Suppose that you are fitting the linear model  and that the error terms satisfy the usual assumptions (uncorrelated, zero mean, homogeneous variance). Further, suppose that
  is partitioned according to several model effects,
 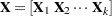 . If
. If  denotes the ordinary least squares solution for this model, then the sum of squares attributable to the overall model can be written as
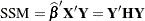 |
where  is the "hat" matrix
 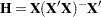 . (This model sum of squares is not yet corrected for the presence of an explicit or implied intercept. This adjustment would consist of subtracting
  from SSM.) Because of the properties of the hat matrix , you can write
  and
and  . The (uncorrected) model sum of squares thus can also be written as
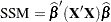 |
This step is significant, because it demonstrates that sums of squares can be identified with quadratic functions in the least squares coefficients. The generalization of this idea is to do the following:
consider hypotheses of interest in an analysis of variance model
express the hypotheses in terms of linear estimable functions of the parameters
compute the sums of squares associated with the estimable function
construct statistical tests based on the sums of squares
Decomposing a model sum of squares into sequential, additive components, testing the significance of experimental factors, comparing factor levels, and performing other statistical inferences fall within this generalization. Suppose that  is an estimable function (see the section Estimable Functions in
Chapter 3,
Introduction to Statistical Modeling with SAS/STAT Software,
and
Chapter 15,
The Four Types of Estimable Functions,
for details). The sum of squares associated with the hypothesis
is an estimable function (see the section Estimable Functions in
Chapter 3,
Introduction to Statistical Modeling with SAS/STAT Software,
and
Chapter 15,
The Four Types of Estimable Functions,
for details). The sum of squares associated with the hypothesis  is
is
 |
One application would be to form sums of squares associated with the different components of . For example, you can form a matrix  matrix such that
  tests the effect of adding the columns for
  to an empty model or to test the effect of adding to a model that already contains
  .
.
These sums of squares can also be expressed as the difference between two residual sums of squares, since  can be thought of as a (linear) restriction on the parameter estimates in the model:
 |
If, in addition to the usual assumptions mentioned previously, the model errors are assumed to be normally distributed, then  follows a distribution that is proportional to a chi-square distribution. This fact, and the independence of from the residual sum of squares, enables you to construct F tests based on sums of squares in least squares models.
The extension of sum of squares analysis of variance to general analysis of variance for classification effects depends on the fact that the distributional properties of quadratic forms in normal random variables are well understood. It is not necessary to first formulate a sum of squares to arrive at an exact or even approximate F test. The generalization of the expression for is to form test statistics based on quadratic forms
 |
that follow a chi-square distribution if is normally distributed.
Copyright © SAS Institute, Inc. All Rights Reserved.