| The FREQ Procedure |
Measures of Association
When you specify the MEASURES option in the TABLES statement, PROC FREQ computes several statistics that describe the association between the row and column variables of the contingency table. The following are measures of ordinal association that consider whether the column variable Y tends to increase as the row variable X increases: gamma, Kendall’s tau- , Stuart’s tau-
 , and Somers’
  . These measures are appropriate for ordinal variables, and they classify pairs of observations as concordant or discordant. A pair is concordant if the observation with the larger value of X also has the larger value of Y. A pair is discordant if the observation with the larger value of X has the smaller value of Y. See Agresti (2007) and the other references cited for the individual measures of association.
The Pearson correlation coefficient and the Spearman rank correlation coefficient are also appropriate for ordinal variables. The Pearson correlation describes the strength of the linear association between the row and column variables, and it is computed by using the row and column scores specified by the SCORES= option in the TABLES statement. The Spearman correlation is computed with rank scores. The polychoric correlation (requested by the PLCORR option) also requires ordinal variables and assumes that the variables have an underlying bivariate normal distribution. The following measures of association do not require ordinal variables and are appropriate for nominal variables: lambda asymmetric, lambda symmetric, and the uncertainty coefficients.
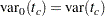
PROC FREQ computes estimates of the measures according to the formulas given in the following sections. For each measure, PROC FREQ computes an asymptotic standard error ( ), which is the square root of the asymptotic variance denoted by
  in the following sections.
Confidence Limits
If you specify the CL option in the TABLES statement, PROC FREQ computes asymptotic confidence limits for all MEASURES statistics. The confidence coefficient is determined according to the value of the ALPHA= option, which, by default, equals 0.05 and produces 95% confidence limits.
The confidence limits are computed as
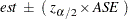 |
where  is the estimate of the measure,
  is the
  th percentile of the standard normal distribution, and is the asymptotic standard error of the estimate.
Asymptotic Tests
For each measure that you specify in the TEST statement, PROC FREQ computes an asymptotic test of the null hypothesis that the measure equals zero. Asymptotic tests are available for the following measures of association: gamma, Kendall’s tau-, Stuart’s tau-, Somers’  , Somers’
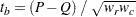
  , the Pearson correlation coefficient, and the Spearman rank correlation coefficient. To compute an asymptotic test, PROC FREQ uses a standardized test statistic
  , which has an asymptotic standard normal distribution under the null hypothesis. The test statistic is computed as
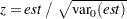 |
where is the estimate of the measure and  is the variance of the estimate under the null hypothesis. Formulas for for the individual measures of association are given in the following sections.
Note that the ratio of to  is the same for the following measures: gamma, Kendall’s tau-, Stuart’s tau-, Somers’ , and Somers’ . Therefore, the tests for these measures are identical. For example, the
  -values for the test of
  equal the -values for the test of
  .
.
PROC FREQ computes one-sided and two-sided -values for each of these tests. When the test statistic  is greater than its null hypothesis expected value of zero, PROC FREQ displays the right-sided -value, which is the probability of a larger value of the statistic occurring under the null hypothesis. A small right-sided -value supports the alternative hypothesis that the true value of the measure is greater than zero. When the test statistic is less than or equal to zero, PROC FREQ displays the left-sided -value, which is the probability of a smaller value of the statistic occurring under the null hypothesis. A small left-sided -value supports the alternative hypothesis that the true value of the measure is less than zero. The one-sided -value
  can be expressed as
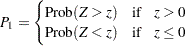 |
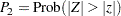
where  has a standard normal distribution. The two-sided p-value
  is computed as
 |
Exact Tests
Exact tests are available for the following measures of association: Kendall’s tau-, Stuart’s tau-, Somers’  and
and  , the Pearson correlation coefficient, and the Spearman rank correlation coefficient. If you request an exact test for a measure of association in the EXACT statement, PROC FREQ computes the exact test of the hypothesis that the measure equals zero. See the section Exact Statistics for details.
Gamma
The gamma ( ) statistic is based only on the number of concordant and discordant pairs of observations. It ignores tied pairs (that is, pairs of observations that have equal values of
  or equal values of
  ). Gamma is appropriate only when both variables lie on an ordinal scale. The range of gamma is
  . If the row and column variables are independent, then gamma tends to be close to zero. Gamma is estimated by
 |
and the asymptotic variance is
 |
For  tables, gamma is equivalent to Yule’s
  . See Goodman and Kruskal (1979) and Agresti (2002) for more information.
The variance under the null hypothesis that gamma equals zero is computed as
 |
See Brown and Benedetti (1977) for details.
Kendall’s Tau-b
Kendall’s tau- ( ) is similar to gamma except that tau- uses a correction for ties. Tau- is appropriate only when both variables lie on an ordinal scale. The range of tau- is
  . Kendall’s tau- is estimated by
 |
and the asymptotic variance is
 |
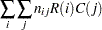
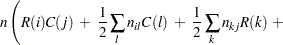
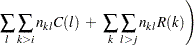
where
 |
 |
 |
|||
 |
|
 |
|||
 |
|
 |
|||
 |
|
 |
|||
 |
|
 |
See Kendall (1955) for more information.
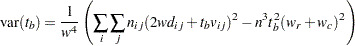
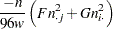
The variance under the null hypothesis that tau- equals zero is computed as
 |
See Brown and Benedetti (1977) for details.
PROC FREQ also provides an exact test for the Kendall’s tau-. You can request this test by specifying the KENTB option in the EXACT statement. See the section Exact Statistics for more information.
Stuart’s Tau-c
Stuart’s tau- ( ) makes an adjustment for table size in addition to a correction for ties. Tau- is appropriate only when both variables lie on an ordinal scale. The range of tau- is
  . Stuart’s tau- is estimated by
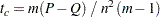 |
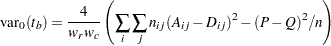
and the asymptotic variance is
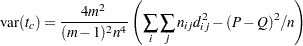 |
where  and
and  . The variance under the null hypothesis that tau- equals zero is the same as the asymptotic variance ,
 |
See Brown and Benedetti (1977) for details.
PROC FREQ also provides an exact test for the Stuart’s tau-. You can request this test by specifying the STUTC option in the EXACT statement. See the section Exact Statistics for more information.
Somers’ D
Somers’ and Somers’ are asymmetric modifications of tau-.  indicates that the row variable X is regarded as the independent variable and the column variable Y is regarded as dependent. Similarly,
  indicates that the column variable Y is regarded as the independent variable and the row variable X is regarded as dependent. Somers’ differs from tau- in that it uses a correction only for pairs that are tied on the independent variable. Somers’ is appropriate only when both variables lie on an ordinal scale. The range of Somers’ is
  . Somers’ is computed as
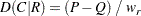 |
and its asymptotic variance is
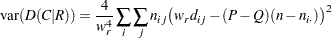 |
where and
 |
See Somers (1962), Goodman and Kruskal (1979), and Liebetrau (1983) for more information.
The variance under the null hypothesis that equals zero is computed as
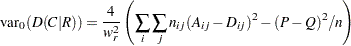 |
See Brown and Benedetti (1977) for details.
Formulas for Somers’ are obtained by interchanging the indices.
PROC FREQ also provides exact tests for Somers’ and . You can request these tests by specifying the SMDCR and SMDCR options in the EXACT statement. See the section Exact Statistics for more information.
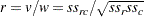
Pearson Correlation Coefficient
The Pearson correlation coefficient ( ) is computed by using the scores specified in the SCORES= option. This measure is appropriate only when both variables lie on an ordinal scale. The range of the Pearson correlation is
  . The Pearson correlation coefficient is estimated by
 |
and its asymptotic variance is
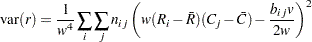 |
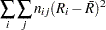
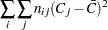
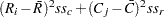
where  and
and  are the row and column scores and
 |
|
 |
|||
 |
|
 |
|||
 |
|
 |
 |
|
 |
|||
 |
|
|
|||
|
|
 |
See Snedecor and Cochran (1989) for more information.
The SCORES= option in the TABLES statement determines the type of row and column scores used to compute the Pearson correlation (and other score-based statistics). The default is SCORES=TABLE. See the section Scores for details about the available score types and how they are computed.
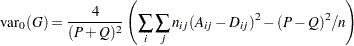
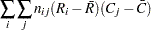
The variance under the null hypothesis that the correlation equals zero is computed as
 |
Note that this expression for the variance is derived for multinomial sampling in a contingency table framework, and it differs from the form obtained under the assumption that both variables are continuous and normally distributed. See Brown and Benedetti (1977) for details.
PROC FREQ also provides an exact test for the Pearson correlation coefficient. You can request this test by specifying the PCORR option in the EXACT statement. See the section Exact Statistics for more information.
Spearman Rank Correlation Coefficient
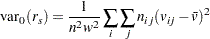
The Spearman correlation coefficient ( ) is computed by using rank scores, which are defined in the section Scores. This measure is appropriate only when both variables lie on an ordinal scale. The range of the Spearman correlation is
  . The Spearman correlation coefficient is estimated by
 |
and its asymptotic variance is
 |
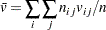
where  and
and  are the row and column rank scores and
|
|
 |
|||
|
|
 |
|||
 |
|
 |
|||
 |
|
 |
 |
|
 |
|||
 |
|
 |
|||
 |
|
 |
|||
 |
|
 |
|||
|
|
 |
|||
 |
|
 |
|||
 |
|
 |
See Snedecor and Cochran (1989) for more information.
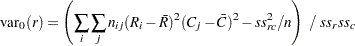
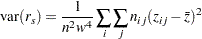
The variance under the null hypothesis that the correlation equals zero is computed as
 |
where
 |
Note that the asymptotic variance is derived for multinomial sampling in a contingency table framework, and it differs from the form obtained under the assumption that both variables are continuous and normally distributed. See Brown and Benedetti (1977) for details.
PROC FREQ also provides an exact test for the Spearman correlation coefficient. You can request this test by specifying the SCORR option in the EXACT statement. See the section Exact Statistics for more information.
Polychoric Correlation
When you specify the PLCORR option in the TABLES statement, PROC FREQ computes the polychoric correlation. This measure of association is based on the assumption that the ordered, categorical variables of the frequency table have an underlying bivariate normal distribution. For tables, the polychoric correlation is also known as the tetrachoric correlation. See Drasgow (1986) for an overview of polychoric correlation. The polychoric correlation coefficient is the maximum likelihood estimate of the product-moment correlation between the normal variables, estimating thresholds from the observed table frequencies. The range of the polychoric correlation is from –1 to 1. Olsson (1979) gives the likelihood equations and an asymptotic covariance matrix for the estimates.
To estimate the polychoric correlation, PROC FREQ iteratively solves the likelihood equations by a Newton-Raphson algorithm that uses the Pearson correlation coefficient as the initial approximation. Iteration stops when the convergence measure falls below the convergence criterion or when the maximum number of iterations is reached, whichever occurs first. The CONVERGE= option sets the convergence criterion, and the default value is 0.0001. The MAXITER= option sets the maximum number of iterations, and the default value is 20.
Lambda (Asymmetric)
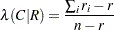
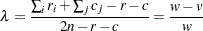
Asymmetric lambda,  , is interpreted as the probable improvement in predicting the column variable Y given knowledge of the row variable X. The range of asymmetric lambda is
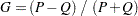
  . Asymmetric lambda () is computed as
 |
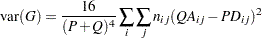
and its asymptotic variance is
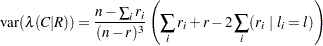 |
where
 |
|
 |
|||
 |
|
 |
|||
 |
|
 |
|||
 |
|
 |
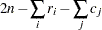
The values of  and
and  are determined as follows. Denote by the unique value of
  such that
  , and let be the unique value of such that
  . Because of the uniqueness assumptions, ties in the frequencies or in the marginal totals must be broken in an arbitrary but consistent manner. In case of ties, is defined as the smallest value of such that
  .
.
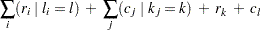
For those columns containing a cell  for which
  ,
,  records the row in which
  is assumed to occur. Initially is set equal to –1 for all . Beginning with
  , if there is at least one value such that
  , and if
  , then is defined to be the smallest such value of , and is set equal to
  . Otherwise, if
  , then is defined to be equal to . If neither condition is true, then is taken to be the smallest value of such that
  .
.
The formulas for lambda asymmetric can be obtained by interchanging the indices.
See Goodman and Kruskal (1979) for more information.
Lambda (Symmetric)
The nondirectional lambda is the average of the two asymmetric lambdas, and  . Its range is
  . Lambda symmetric is computed as
 |
and its asymptotic variance is computed as
 |
where
|
|
|
|||
|
|
|
|||
|
|
|
|||
|
|
|
|||
|
|
 |
|||
|
|
 |
|||
 |
|
 |
|||
 |
|
 |
The definitions of and are given in the previous section. The values  and
and  are defined in a similar way for lambda asymmetric ().
See Goodman and Kruskal (1979) for more information.
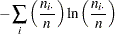
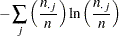
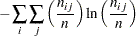
Uncertainty Coefficients (Asymmetric)
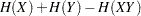
The uncertainty coefficient  measures the proportion of uncertainty (entropy) in the column variable Y that is explained by the row variable X. Its range is
  . The uncertainty coefficient is computed as
 |
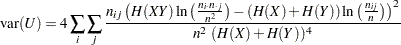
and its asymptotic variance is
 |
where
|
|
 |
|||
|
|
 |
|||
 |
|
 |
|||
|
|
 |
|||
 |
|
 |
The formulas for the uncertainty coefficient  can be obtained by interchanging the indices.
See Theil (1972, pp. 115–120) and Goodman and Kruskal (1979) for more information.
Uncertainty Coefficient (Symmetric)
The uncertainty coefficient  is the symmetric version of the two asymmetric uncertainty coefficients. Its range is
  . The uncertainty coefficient is computed as
 |
and its asymptotic variance is
 |
where  ,
,  , and
, and  are defined in the previous section. See Goodman and Kruskal (1979) for more information.
Copyright © SAS Institute, Inc. All Rights Reserved.