| The SURVEYFREQ Procedure |
Odds Ratio and Relative Risks
The OR option provides estimates of the odds ratio, the column 1 relative risk, and the column 2 relative risk for  tables, together with their confidence limits.
Odds Ratio
For a table, the odds of a positive (column 1) response in row 1 is  . Similarly, the odds of a positive response in row 2 is
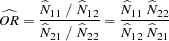
  . The odds ratio is formed as the ratio of the row 1 odds to the row 2 odds. The estimate of the odds ratio is computed as
 |
The value of the odds ratio can be any nonnegative number. When the row and column variables are independent, the true value of the odds ratio equals 1. An odds ratio greater than 1 indicates that the odds of a positive response are higher in row 1 than in row 2. An odds ratio less than 1 indicates that the odds of positive response are higher in row 2. The strength of association increases with the deviation from 1. See Stokes, Davis, and Koch (2000) and Agresti (2007) for details.
PROC SURVEYFREQ constructs confidence limits for the odds ratio by using the log transform. The  % confidence limits for the odds ratio are computed as
 |
where
 |
is the estimate of the variance of the log odds ratio, and where  is the
  th percentile of the t distribution with df degrees of freedom. The computation of df is described in the section Degrees of Freedom. The value of the confidence coefficient
  is determined by the ALPHA= option, which by default equals 0.05 and produces 95% confidence limits.
If you request BRR variance estimation (VARMETHOD=BRR), PROC SURVEYFREQ estimates the variance of the odds ratio as described in the section Balanced Repeated Replication (BRR). If you request jackknife variance estimation (VARMETHOD=JACKKNIFE), the procedure estimates the variance as described in the section The Jackknife.
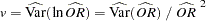
If you do not specify the VARMETHOD= option or a REPWEIGHTS statement, the default variance estimation method is Taylor series (VARMETHOD=TAYLOR). By using Taylor series linearization, the variance estimate for the odds ratio can be expressed as
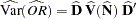 |
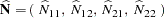
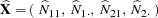
where  is the covariance matrix of the estimates of the cell totals
  ,
,
 |
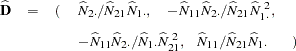
and  is an array containing the partial derivatives of the odds ratio with respect to the elements of . The section Covariance of Totals describes the computation of . The array is computed as
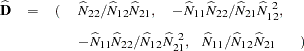 |
See Wolter (1985, pp. 239–242) for more information.
Relative Risks
For a table, the column 1 relative risk is the ratio of the column 1 risks for row 1 to row 2. As described in the section Risks and Risk Difference, the column 1 risk for row 1 is the proportion of row 1 observations classified in column 1, and the column 1 risk for row 2 is the proportion of row 2 observations classified in column 1. The estimate of the column 1 relative risk is computed as
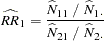 |
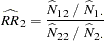
Similarly, the estimate of the column 2 relative risk is computed as
 |
A relative risk greater than 1 indicates that the probability of positive response is greater in row 1 than in row 2. Similarly, a relative risk less than 1 indicates that the probability of positive response is less in row 1 than in row 2. The strength of association increases with the deviation from 1. See Stokes, Davis, and Koch (2000) and Agresti (2007) for more information.
PROC SURVEYFREQ constructs confidence limits for the relative risk by using the log transform, which is similar to the odds ratio computations described previously. The % confidence limits for the column 1 relative risk are computed as
 |
where
 |
is the estimate of the variance of the log column 1 relative risk, and where is the th percentile of the t distribution with df degrees of freedom. The computation of df is described in the section Degrees of Freedom. The value of the confidence coefficient is determined by the ALPHA= option, which by default equals 0.05 and produces 95% confidence limits.
If you request BRR variance estimation (VARMETHOD=BRR), PROC SURVEYFREQ estimates the variance of the column 1 relative risk as described in the section Balanced Repeated Replication (BRR). If you request jackknife variance estimation (VARMETHOD=JACKKNIFE), the procedure estimates the variance as described in the section The Jackknife.
If you do not specify the VARMETHOD= option or a REPWEIGHTS statement, the default variance estimation method is Taylor series (VARMETHOD=TAYLOR). By using Taylor series linearization, the variance estimate for the column 1 relative risk can be expressed as
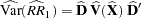 |
where  is the covariance matrix of
  ,
,
 |
and is an array containing the partial derivatives of the column 1 relative risk with respect to the elements of ,
 |
See Wolter (1985, pp. 239–242) for more information.
Confidence limits for the column 2 relative risk are computed similarly.
Copyright © 2009 by SAS Institute Inc., Cary, NC, USA. All rights reserved.