| The REG Procedure |
| Construction of Q-Q and P-P Plots |
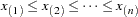
If a normal probability-probability or quantile-quantile plot for the variable  is requested, the
  nonmissing values of are first ordered from smallest to largest:
 |
If a Q-Q plot is requested (with a PLOT statement of the form PLOT yvariable NQQ.), the
  th-ordered value
  is represented by a point with y-coordinate and x-coordinate
  , where
  is the standard normal distribution.
If a P-P plot is requested (with a PLOT statement of the form PLOT yvariableNPP.), the th-ordered value is represented by a point with y-coordinate  and x-coordinate
  , where
  is the mean of the nonmissing -values and
  is the standard deviation. If an -value has multiplicity
  (that is,
 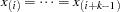 ), then only the point
 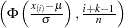 is displayed.
Copyright © 2009 by SAS Institute Inc., Cary, NC, USA. All rights reserved.