| The LOGISTIC Procedure |
| Model Fitting Information |
For the  th observation, let
  be the estimated probability of the observed response. The three criteria displayed by the LOGISTIC procedure are calculated as follows:
–2 Log Likelihood:
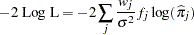
where
 and
and  are the weight and frequency values of the th observation, and
  is the dispersion parameter, which equals
  unless the SCALE= option is specified. For binary response models that use events/trials MODEL syntax, this is equivalent to
where
 is the number of events,
  is the number of trials, and is the estimated event probability.
 Akaike Information Criterion:

where
 is the number of parameters in the model. For cumulative response models,
  , where
  is the total number of response levels minus one and
  is the number of explanatory effects. For the generalized logit model,
  .
. Schwarz (Bayesian Information) Criterion:
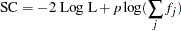
where
is the number of parameters in the model.
The AIC and SC statistics give two different ways of adjusting the –2 Log L statistic for the number of terms in the model and the number of observations used. These statistics can be used when comparing different models for the same data (for example, when you use the SELECTION=STEPWISE option in the MODEL statement). The models being compared do not have to be nested; lower values of the statistics indicate a more desirable model.
The difference in the –2 Log L statistics between the intercepts-only model and the specified model has a  degree-of-freedom chi-square distribution under the null hypothesis that all the explanatory effects in the model are zero, where is the number of parameters in the specified model and is the number of intercepts. The likelihood ratio test in the "Testing Global Null Hypothesis: BETA=0" table displays this difference and the associated p-value for this statistic. The score and Wald tests in that table test the same hypothesis and are asymptotically equivalent; see the sections Residual Chi-Square and Testing Linear Hypotheses about the Regression Coefficients for details.
Copyright © 2009 by SAS Institute Inc., Cary, NC, USA. All rights reserved.