| The GLIMMIX Procedure |
Fit Statistics
The "Fit Statistics" table provides statistics about the estimated model. The first entry of the table corresponds to the negative of twice the (possibly restricted) log likelihood, log pseudo-likelihood, or log quasi-likelihood. If the estimation method permits the true log likelihood or residual log likelihood, the description of the first entry reads accordingly. Otherwise, the fit statistics are preceded by the words Pseudo- or Quasi-, for Pseudo- and Quasi-Likelihood estimation, respectively.
Note that the (residual) log pseudo-likelihood in a GLMM is the (residual) log likelihood of a linearized model. You should not compare these values across different statistical models, even if the models are nested with respect to fixed and/or G-side random effects. It is possible that between two nested models the larger model has a smaller pseudo-likelihood. For this reason, IC=NONE is the default for GLMMs fit by pseudo-likelihood methods.
See the IC= option of the PROC GLIMMIX statement and Table 38.2 for the definition and computation of the information criteria reported in the "Fit Statistics" table.
For generalized linear models, the GLIMMIX procedure reports Pearson’s chi-square statistic
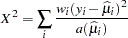 |
where  is the variance function evaluated at the estimated mean.
For GLMMs, the procedure typically reports a generalized chi-square statistic,
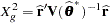 |
so that the ratio of  or
or  and the degrees of freedom produces the usual residual dispersion estimate.
If the R-side scale parameter  is not extracted from
  , the GLIMMIX procedure computes
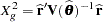 |
as the generalized chi-square statistic. This is the case, for example, if R-side covariance structures are varied by a GROUP= effect or if the scale parameter is not profiled for an R-side TYPE=CS, TYPE=SP, TYPE=AR, TYPE=TOEP, or TYPE=ARMA covariance structure.
For METHOD=LAPLACE, the generalized chi-square statistic is not reported. Instead, the Pearson statistic for the conditional distribution appears in the "Conditional Fit Statistics" table.
If your model contains smooth components (such as TYPE=RSMOOTH), then the "Fit Statistics" table also displays the residual degrees of freedom of the smoother. These degrees of freedom are computed as
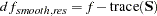 |
where  is the "smoother" matrix—that is, the matrix that produces the predicted values on the linked scale.
For ODS purposes, the name of the "Fit Statistics" table is "FitStatistics."
Copyright © 2009 by SAS Institute Inc., Cary, NC, USA. All rights reserved.