Examples of Simulation Studio Models
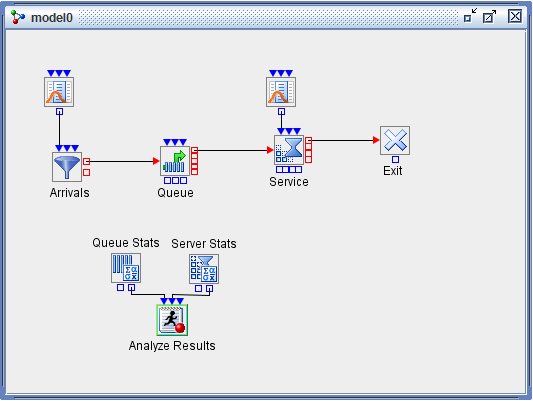
This very simple model illustrates the use of the SAS Program block to receive data from a run of the simulation model, analyze the data using SAS procedures, and produce SAS graphical output from the analyses. Note that although a SAS program is used in this example, the SAS Program block can also be used with a program written in JMP Script. This model simulates an M/M/1 system; arrivals and service times are exponentially distributed and there is a single server. The model is shown in Figure E.25.
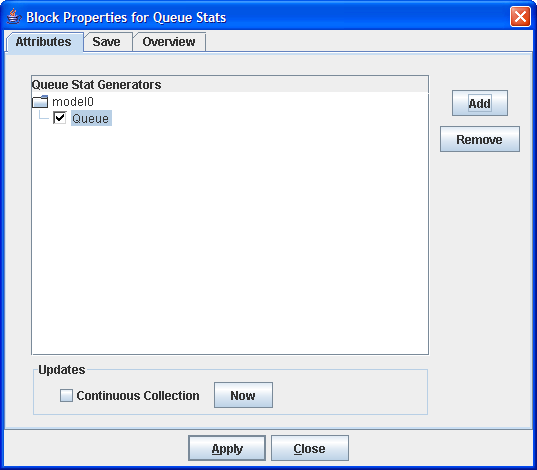
Two additional blocks gather data from the model: a Queue Stats Collector block and a Server Stats Collector block. The Queue Stats Collector block can collect data from every Queue block in the model, and the Server Stats Collector block can do the same for every Server block. For this model there is only one Queue block and one Server block, and so the properties dialog box for the Queue Stats Collector block lists only one possible source of data, as shown in Figure E.26.
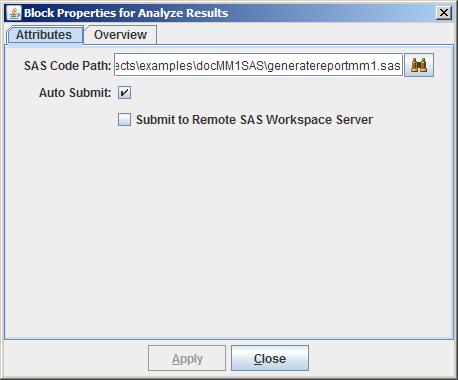
The remaining block in the model is the SAS Program block labeled Analyze Results, which pulls data from the Queue Stats Collector and Server Stats Collector blocks via its InQueueData and InServerData input ports, respectively. The SAS Program block then runs the SAS program specified in the SAS Code Path field of its properties dialog box, as shown in Figure E.27.
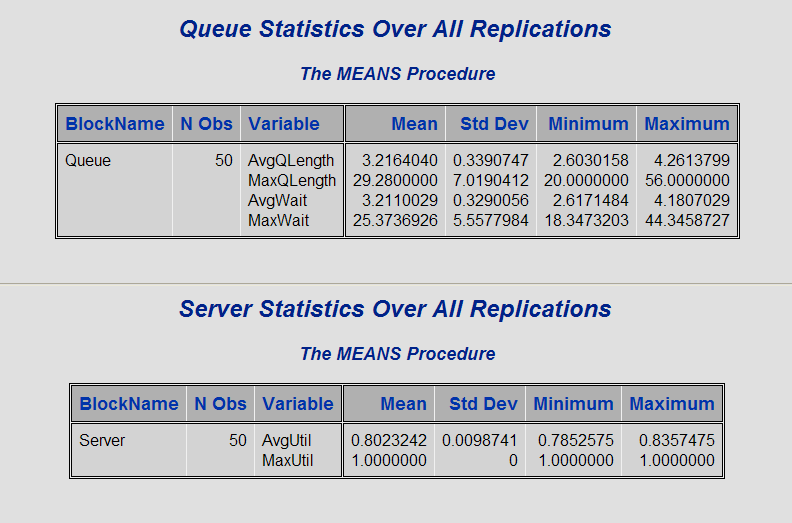
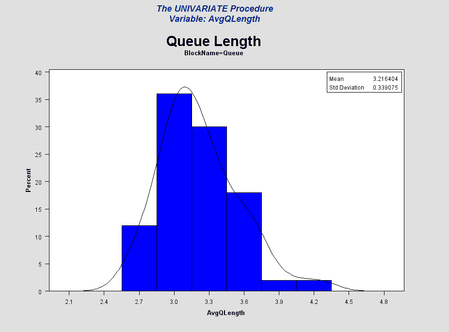
The SAS program generatereportmm1.sas uses the Base SAS MEANS and UNIVARIATE procedures to analyze the waiting times and length for the queue and the utilization
of the single server. It produces output in HTML format, excerpts of which are shown in Figure E.28 and Figure E.29. In order to generate data for these analyses, the model is run for 50 replications of 10,000 time units each.
