Examples of Simulation Studio Models
This example demonstrates how to use Switch and Formula blocks to route entities to the queue that has the shortest length when multiple queues are available. It also uses the Queue Stats Collector block, the Bucket block, and various Plot blocks to illustrate statistics collection and visualization. Entities are created according to an exponential distribution with a mean of 1. Figure E.2 shows three queues in which entities wait for a single server. Entities are routed to the queue with the shortest length. If all three queues have the same length, the entity routes to Queue1. The time it takes for each entity to be served is sampled from an exponential distribution with a mean of 1. The simulation is run for 5,000 time units, and the Entity Generator block shuts down after 4,970 time units to make sure that entities are being pulled from all three queues. (By default, the server checks Queue1 first to determine whether any entities are waiting, and then Queue2, and then Queue3. Thus entities move out of Queue3 only if Queue1 and Queue2 are empty.)
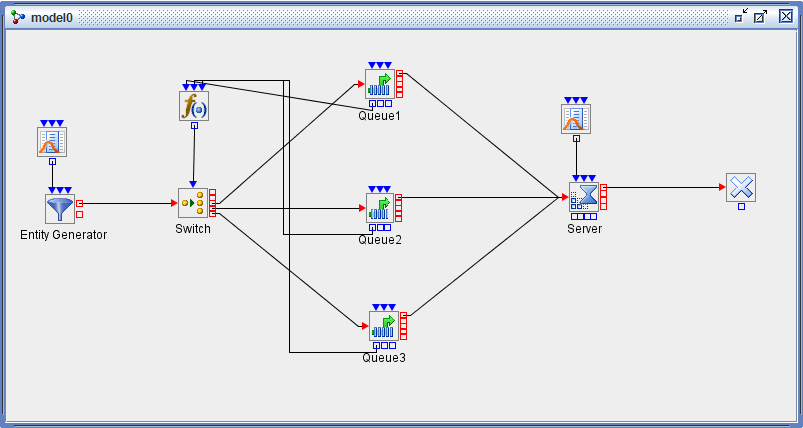
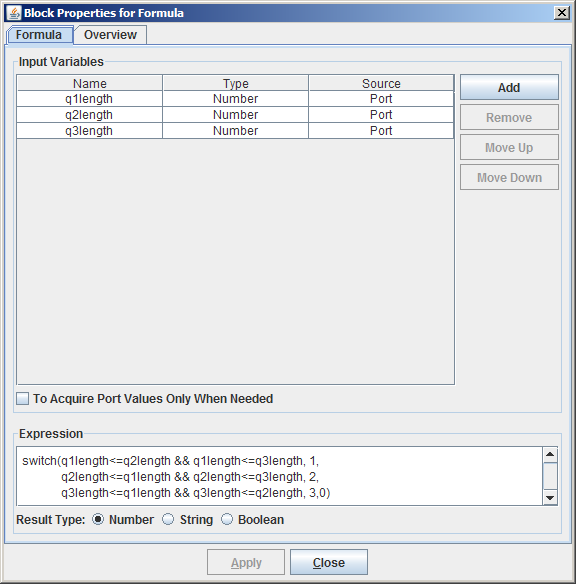
After the Entity Generator block creates an entity, the entity flows to the Switch block for routing to the desired queue. When an entity arrives at the Switch block, the Switch block pulls a value from the Formula block attached to the Switch block’s InData port. Figure E.3 shows the Formula block’s expression. The Formula block pulls the queue length from each of the queues in the model and then returns a value of 1, 2, or 3 (indicating the shortest queue) to the Switch block based on the comparison of the queue lengths.
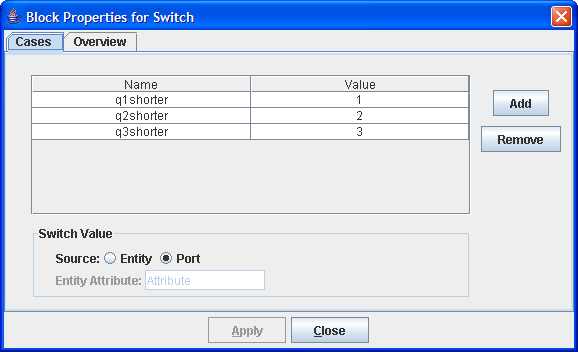
The Switch block attempts to match the value returned by the Formula block with the cases defined on the Switch block. (See Figure E.4.) The entity is then pushed out the port associated with the matched case.
When the Server block becomes available, it attempts to pull an entity from a link connected to its InEntity port. In this example, three links are connected to the Server block’s InEntity port. By convention in Simulation Studio, the pull is attempted from the first link connected to the Server block’s InEntity port during the model construction process. If this is unsuccessful, the Switch block attempts to pull from the second link, and so on. In this example, the link from Queue1 to the Server block was created first, followed by the link from Queue2 to the Server block, and finally from Queue3 to the Server block.
Figure E.5 shows the model in Figure E.2, extended to use the Queue Stats Collector block and the Bucket block to collect statistics and data.
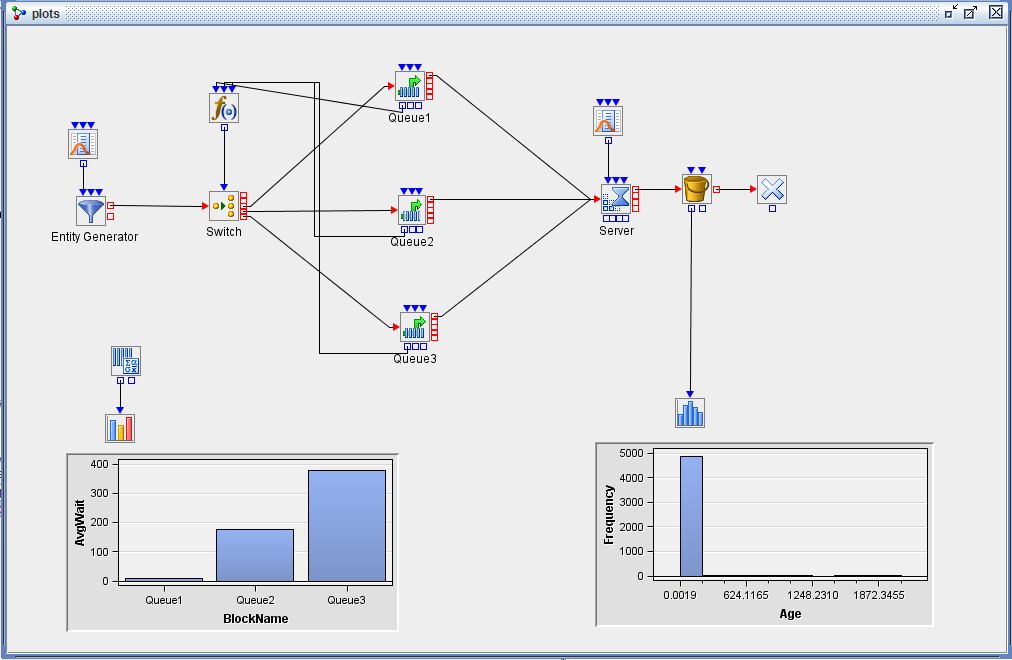
The Bucket block is configured to collect the age attribute of every entity that passes through it and store the value in a SimDataModel. The SimDataModel is passed to a Histogram block where the user has selected to display a histogram of the age variable from the incoming SimDataModel.
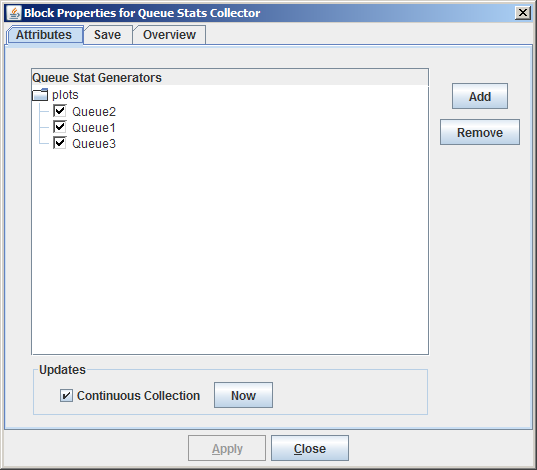
The Queue Stats Collector block in the model has been configured to collect data on all three queues. (See Figure E.6.)
By default, the Queue Stats Collector block saves the following information for each queue it monitors:
- Time
-
time the statistic was recorded
- BlockName
-
name of the queue
- BlockId
-
numeric ID of the queue
- InCount
-
number of entities that enter the queue
- OutCount
-
number of entities that exit the queue via the OutEntity port
- BalkCount
-
number of entities that exit the queue via the OutBalk port
- RenegeCount
-
number of entities that exit the queue via the OutRenege port
- QLength
-
length of the queue at time Time
- AvgQLength
-
average length of the queue
- MaxQLength
-
maximum length of the queue
- AvgWait
-
average wait time in the queue
- MaxWait
-
maximum wait time in the queue
The data are saved in a SimDataModel that is accessible through the OutData port of the Queue Stats Collector block. For this example the Queue Stats Collector block sends its SimDataModel to a Bar Chart block, where the AvgQLength is displayed for each queue. (See Figure E.5.)