One of the default columns in the experiment design matrix is labeled Replicates. The value in this column represents how many times you want to run the associated design point in this experiment. The default value for the entire column is 1 replicate. To edit the default replicate value, right-click in the Experiment window to open the properties dialog box. Each replication run for a given design point uses the same factor levels. However, different random streams (if random streams are used in the model) are used for each replicate.
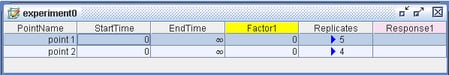
If the number of replicates for a given design point is greater than 1 (and you have included responses in your experiment), a small blue triangle precedes the replication value in the design matrix replication cell. Clicking this triangle causes the replication rows to be expanded or collapsed in the matrix. Figure 5.15 and Figure 5.16 show the different display states.
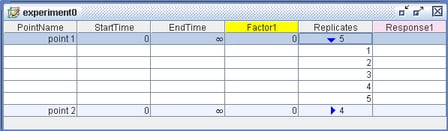
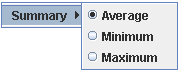
The factor level values are not displayed for each of the replicate rows—only the replication number and any measured response values are displayed. If a design point has replicate rows and it is in a collapsed state, the value displayed for any response value is a summary statistic calculated from all the values collected for that design point for that response. The average value is displayed by default. You can change the summary statistic displayed by right-clicking the appropriate response column heading in the Experiment window and selecting from the statistics available. (See Figure 5.17.)