Chapter 2: Overview of SAS Simulation Studio, first introduced this example, and it is discussed here because of its wide applicability. An M/M/1 queueing model can be used to represent many different real-life situations such as customers checking out at a supermarket, customers at a bank, and so on. This model illustrates the basic concepts involved in building models in Simulation Studio, and it is a good starting point for constructing more sophisticated models. In some ways this example is analogous to the “hello, world” introductory example used to illustrate many programming languages.
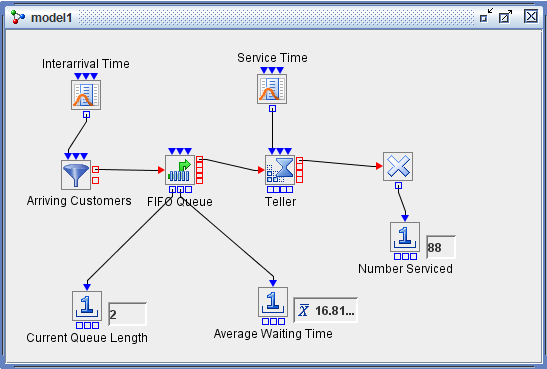
The details for building and running the M/M/1 queueing model depicted in Figure E.1 are provided in Chapter 2: Overview of SAS Simulation Studio; rather than repeating them here, this section provides suggestions for experimenting with this model to familiarize yourself with various features and functionality in Simulation Studio.
This model provides a good vehicle for acquainting yourself with the Log and Trace features in Simulation Studio. If you delete the link between the blocks labeled Interarrival Time and Arriving Customers and then attempt to run the model, a SEVERE level message is posted to the log with the description “Arriving Customers has no inter-arrival time connections.” The model does not run because SEVERE log messages always halt the execution of the simulation model.
Reconnect the Interarrival Time and Arriving Customer blocks and change the distribution associated with the Interarrival Time block to one that is likely to produce negative numbers, such as the uniform distribution with parameters min=–2 and max=2. When you run the model now, you see WARNING messages posted to log with the message “Arriving Customers inter-arrival time value is negative; using 0.0 instead.” The simulation continues to run after WARNING messages are posted.
If you enable the Tracer (Chapter 10: Model Debugging and Verification) and then run the model, trace messages are generated by the various blocks and displayed in the Trace window. Each line in the Trace window contains the name of the block that creates the message and a short description of the event. An example trace message here might be “Numeric Source: Sampling, value = 0.136.” The Tracer facility can generate many, many trace messages. See the section Tracing Configuration for details about how to reduce the number of generated trace messages.
You can also use this model to practice defining factors, responses, and anchors and then use them to set up a simple experiment. Details are found in Chapter 5: Experiments. For this example you can define a factor for changing the capacity of the Teller block and a response for recording the average wait time at the Queue block. After you create anchors between the new factor and response to the appropriate blocks in the model, you can include the factor and response in an Experiment window. After the factor and response are included in an Experiment window, you can create multiple design points with different values for the capacity factor, run the experiment, and compare the results.
It is easy to extend this M/M/1 model to incorporate many other Simulation Studio blocks and features such as data collection, plots, and so on to familiarize yourself with these capabilities so that you can apply them later in more sophisticated models.