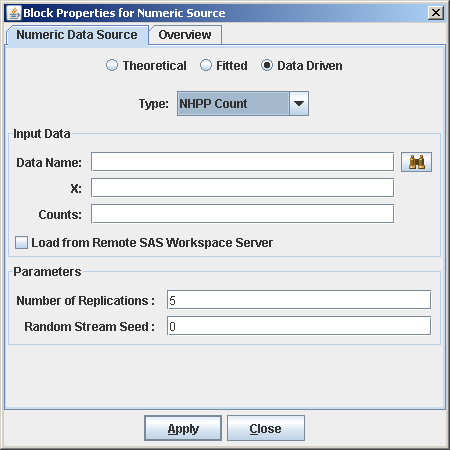
A method described in Leemis (2004) is used for generating arrival times from an estimated NHPP. This method uses event-time data that are given as counts that occur in disjoint subintervals (as opposed to the event times themselves). For the NHPP Count option under the Data Driven option of a Numeric Source block, the following inputs are required as shown in Figure B.4:
-
Data Name: The location of the SAS data set or JMP table that contains the data to be used to estimate a cumulative intensity (rate) function.
-
X: Name of the column in the data set that specifies the subinterval cutoff points
 so that the NHPP has an intensity function that is piecewise constant on each subinterval
 ![$(x_0,x_1],(x_1,x_2],...,(x_{m-1},x_ m]$](images/simsug_app20109.png) . The subintervals do not necessarily have equal widths. The NHPP is defined on the time interval
. The subintervals do not necessarily have equal widths. The NHPP is defined on the time interval ![$(0,S]$](images/simsug_app20104.png) so that
so that  ,
,  , and
, and  is the number of subintervals. The time units must be consistent with the data. For example, if the interval of interest
is from 1:00 p.m. to 5:30 p.m., then the interval
is the number of subintervals. The time units must be consistent with the data. For example, if the interval of interest
is from 1:00 p.m. to 5:30 p.m., then the interval ![$(x_0,x_ m]$](images/simsug_app20112.png) is
is ![$(0,4.5]$](images/simsug_app20113.png) if the data are in hours or
if the data are in hours or ![$(0,270]$](images/simsug_app20114.png) if the data are in minutes.
if the data are in minutes.
-
Counts: Name of the column in the data set where each value
 is the total number of observed events in each subinterval over all replications. Specifically,
  is the total number of observed events in the subinterval
 ![$(x_0,x_1]$](images/simsug_app20116.png) . The length of the Counts column should be one less than the length of the X column.
. The length of the Counts column should be one less than the length of the X column.
-
Number of Replications: The number of realizations of the observed process.