Several blocks in Simulation Studio can be used to collect data. One of these blocks used in the repair shop model is the
Server Stats Collector block
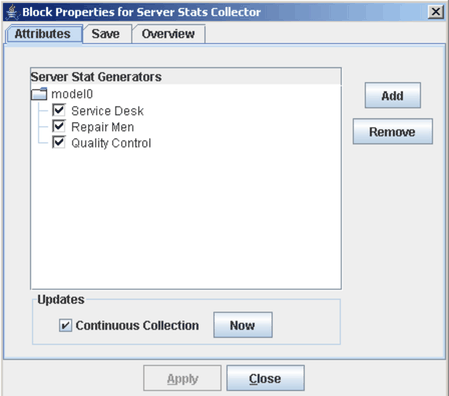
 . This block can be placed anywhere in the model window because entities do not flow through it. Figure 2.10 shows the properties dialog box for the Server Stats Collector block. A list of all blocks that implement the ServerStats
interface in the model is shown, and you can select the ones for which you want to collect statistics. The data collected
for each replication can be saved to a file as a SAS data set or JMP table or passed to one of the Simulation Studio plotting
blocks.
. This block can be placed anywhere in the model window because entities do not flow through it. Figure 2.10 shows the properties dialog box for the Server Stats Collector block. A list of all blocks that implement the ServerStats
interface in the model is shown, and you can select the ones for which you want to collect statistics. The data collected
for each replication can be saved to a file as a SAS data set or JMP table or passed to one of the Simulation Studio plotting
blocks.
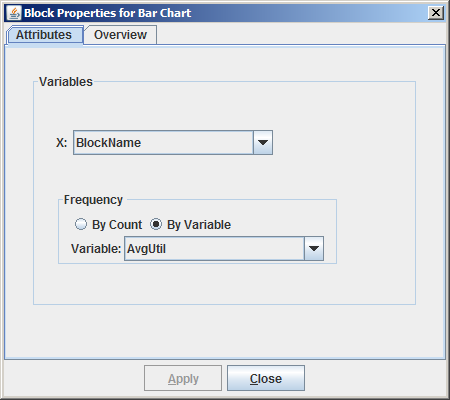
In the repair shop model, a Bar Chart block is connected to the OutData port of the Server Stats Collector block. Figure 2.11 shows the properties dialog box for the Bar Chart block, which requests a bar chart of the average utilization for each of the three servers in the model. After the model is run, the bar chart shows that the average utilization at the quality control station is significantly higher than at the repair or service desks. (See Figure 2.5.)
To further investigate the severity of the bottleneck at the quality control station, you can connect a Number Holder block (labeled WaitingTimeQC) to the OutWait port on the quality control queue. Then you can pass the waiting time values to a Scatter Plot block by connecting the OutCollected port of the Number Holder block to the InData port of the Scatter Plot block. For the plots to display correctly, the Collect Data check box in the Number Holder Block properties dialog box must be selected. (See Figure 2.4.) As the model runs, you see that the waiting time at the quality control station continues to increase. Appendix E: Examples of Simulation Studio Models, revisits this repair shop model.